Combating Hunger in a World of High and Volatile Food Prices
Balancing the potential benefits of biofuel policies with their potential negative impacts on food and feed markets is one of the key challenges.
Note: The views expressed in this chapter are those of the author. They do not necessarily reflect the views of IFPRI, Welthungerhilfe, or Concern Worldwide.
A FEW DEFINITIONS
Price volatility: Price volatility measures the relative rate at which a price of a commodity varies from one period – day, month, or year – to another. Under normal market conditions, some price volatility is expected. If the price of a commodity moves up and down rapidly over a short time period, it has high volatility. If the price almost never changes, it has low volatility. High price volatility can lead to large positive or negative returns for investors.
Price spike: A large, quick, temporary rise or fall in price.
Excessive price volatility: IFPRI has developed a precise definition of excessive price volatility. Using a statistical model based on price data since 1950 and updated daily, it has identified a band within which the change in price moves 95 percent of the time. When the change in price exceeds this threshold at a high frequency (defined with a statistical test) within a 60-day rolling window, price changes are considered to have reached a period of "excessive volatility."
Note: For technical details on definitions, see Appendix D.
PRICE TRANSMISSION FROM INTERNATIONAL TO DOMESTIC PRICES
The degree to which prices are transmitted from international to domestic markets varies among regions. Several IFPRI case studies from Africa, Asia, and Latin America analyzed the transmission of food price changes from international markets to domestic markets. Researchers found that in Latin America, about 20 percent of the change in the international price of wheat is transmitted to the domestic price of bread. There was also evidence that changes in international rice prices are transmitted to domestic markets in most Latin American countries. In Asia, all three countries studied showed transmission of changes in world rice prices to domestic markets, and two out of three showed transmission of world wheat prices. In Sub-Saharan Africa, however, only 13 of 62 price series showed evidence of price transmission over the four to seven years in question.
This difference partly reflects the fact that maize, the staple food in many African countries, is not widely traded. Rice prices were more likely to be linked to world prices than maize prices. On the other hand, almost all African countries studied experienced higher food prices during the 2007–08 global food crisis.
Source: For Latin America, Robles and Torero (2010); for Asia, Robles (2010); and for Africa, Minot (2010).
Agricultural markets and food prices are no longer stable and predictable, if they ever were. After decades of gradually falling food prices, the world is experiencing a period of spikes and rapid swings in food prices and may face more of the same in the coming years. This dramatic shift could have serious implications for the hundreds of millions of people who are already hungry or who are poor and spend a high proportion of their income on food. Efforts to reduce hunger will take place in a new global food economy.
This new reality involves both higher and more volatile prices – two different conditions with distinct implications for consumers and producers. For consumers, rising food prices may have a substantial impact on their welfare by curtailing their ability to purchase food and other necessary goods and services. For producers, higher food prices could raise their incomes – but only if these producers are net sellers of food, if increased global prices reach the markets they participate in, and if their input costs do not also rise. Many of these conditions were not present in the 2010–11 food price crisis.
Price volatility also has significant effects on producers and consumers.
First, higher price volatility is associated with greater potential losses for producers because it implies large, rapid changes in prices, making it more difficult for producers to make optimal decisions about how to allocate inputs into agricultural production. In a period of high price volatility, producers may use fewer inputs like fertilizer and high-quality seeds in their production, they may become more pessimistic in their long-term planning, and they may dampen their investments in areas that improve productivity. These responses by producers reduce supply and lead to increased price levels, which in turn hurt consumers.
Second, many rural households are both producers and consumers of agricultural commodities. As prices become more volatile, these households will be hit from both sides. They will find their incomes reduced because of their inability to optimally allocate inputs and their consumption decisions affected by higher prices in the markets. Finally, increased price volatility over time can also generate larger returns for investors, drawing new investors into the market for agricultural commodities. Increased price volatility may thus lead to increased – potentially speculative – trading that exacerbates price swings.
This is the situation that has prevailed in the years leading up to 2011. The food price crisis of 2007–08 saw a steep rise in food prices (see figure below) that brought food security to the forefront of global attention. Then, in June 2010, food prices started rising again; between June 2010 and May 2011 the international prices of maize and wheat roughly doubled. The peak came in February 2011, according to the Food and Agriculture Organization of the United Nations (FAO), in a spike that was even more pronounced than in 2008 (see, for example, the evolution of prices for maize in the figure below, which exceed 2008 price levels even when adjusting for inflation).
Moreover, recent increases in price volatility are not in line with the historical data (dating back to the late 1950s) and have particularly affected wheat and maize in recent years. For hard wheat (used for bread and flour), for example, there were 165 days of excessive price volatility between December 2001 and December 2006 (an average of 33 days a year), whereas there were 381 days of excessive price volatility between January 2007 and June 2011 (an average of 85 days a year) (see figure below).
Although changes in food prices in international markets do not always reach local markets (see box right), the 2007–08 food price crisis led to economic difficulties for a number of countries, and particularly for already poor populations. It generated social and political turmoil in many countries: Bangladesh, Côte d’Ivoire, Egypt, Haiti, Indonesia, Uzbekistan, Yemen, and 26 other countries saw violent food riots, demonstrations, or social unrest as a result of rising food prices.
In addition to their economic, social, and political impacts, food price spikes and excessive volatility worsen the problem of hunger by increasing poverty. They can lead to long-term, irreversible nutritional damage, especially among children (von Grebmer et al. 2010). For example, across several Latin American countries, simulations have shown important reductions in calorie intake at both the national level and the household level, especially among poor households with children in the critical window from conception to age two.
In all of the Latin American countries studied, poorer households with consumption levels that were already below the calorie adequacy threshold showed greater reductions in calorie intake (Robles and Torero 2010). These long-term effects are especially detrimental to already vulnerable populations, such as those in countries whose GHI score is already alarming or extremely alarming. The effects of high and volatile food prices are also particularly harmful for countries with high net food imports. Because these countries purchase a large share of their food requirements on global food markets, price volatility transmits faster and more directly to the national level. Additionally, countries with high net food imports tend to have high GHI scores (see figure below), and high food inflation affects countries with large numbers of poor people such as China, India, and Indonesia.
Making headway in reducing hunger in this new environment will require an understanding of the causes of food price spikes and excessive price volatility, how these can be curtailed, and the most effective steps to minimize their harmful effects on poor people’s food security and well-being.
How Did We Get Here?
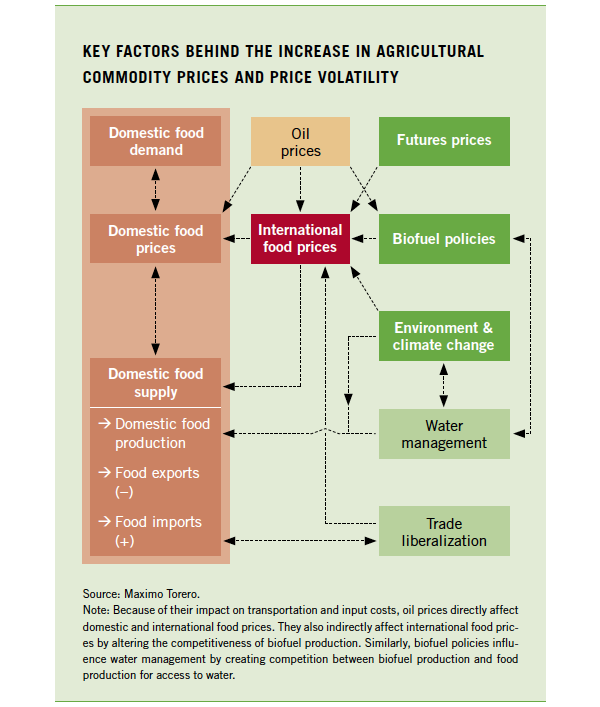
The crises of 2007–08 and 2010–11 were triggered by a complex set of long- and short-term factors, including policy failures and market overreactions. The figure (right) shows the key factors behind the increase in prices and in price volatility; several studies have addressed the different demand - and supply-side factors that contributed to the price crises. Of these factors, three have played the largest role in creating price volatility:
- an increase in biofuel production through fixed mandates that made demand unresponsive to prices, even with volatile oil prices;
- an increase in financial activity through commodity futures markets; and
- the medium- and long-term effects of climate change.
Any of these factors can also be exacerbated by policy responses such as export restrictions by major food exporters. During the 2007–08 food price crisis, 15 countries, including major producers, imposed export restrictions on agricultural commodities. These restrictions led to lower supplies on the global market and contributed to the crisis by provoking panic buying, hoarding, and more export restrictions in other countries, further increasing the amplitude of price movements.
IFPRI research has shown that these trade restrictions can explain as much as 30 percent of the increase in prices in the first six months of 2008. Export restrictions have also contributed to the price increases and general market nervousness experienced in 2010 and 2011.
Biofuels Are Booming.
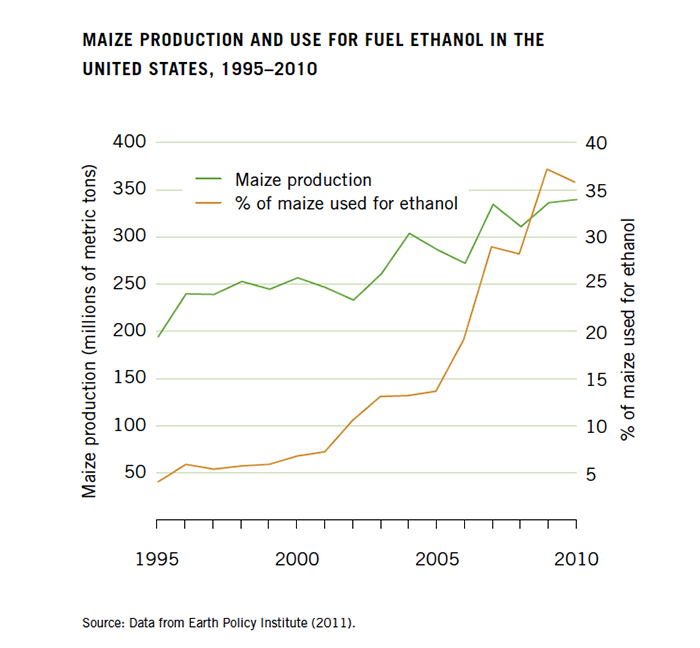
With oil prices at an all-time high (close to US$120 a barrel for Brent crude oil and close to US$100 a barrel for West Texas Intermediate crude oil in July 2011) and with the United States and the European Union subsidizing and setting mandates for biofuel production, farmers have shifted their cultivation toward biofuel crops, and maize production in the United States is increasingly used to produce ethanol (see figure right).
Other countries, including emerging economies such as India and Peru, are also enacting biofuel mandates. This new demand for crops for fuel places new pressures on agricultural markets, which are characterized by temporal restrictions (the time it takes to increase production), limited resources (land, water, and nutrients), and growing demand driven by demographic and income increases. In addition to magnifying the tensions between supply and demand, the rigidity of biofuel mandates exacerbates price fluctuations and magnifies global price volatility. Last but not least, biofuels gradually increase the link between energy markets (which are highly volatile) and food markets (also volatile), further increasing the volatility of the latter.
Traditionally, the energy and food markets have been linked through the agricultural supply channel (such as electricity for irrigation systems and petroleum for fertilizer production). Now energy and food markets are increasingly linked through a new channel – increased demand for crops for fuel even when biofuel mandates are not binding. This link is expected to be stronger as demand for biofuel expands. According to OECD/FAO (2011), biofuel production is projected to more than double from 2007–09 to 2019 and biofuel demand is expected to grow fourfold from 2008 to 2035 (IEA 2010).
In addition, biofuel support is predicted to increase from US$20 billion in 2009 to US$45 billion by 2020 and to US$65 billion by 2035. At the same time, the environmental benefits of biofuel production are being questioned (Al Riffai, Dimaranan, and Laborde 2010a; Laborde 2011).

Marruf Jalloh,
Bo District, Sierra Leone
I usually sell most of my palm oil to traders in the town and not to middlemen at the nearby periodic market. I have a mobile and call my sister in the town for price information. This allows me to plan my sales trips and to receive a better income for my products. Then, I am buying imported rice for my family. In the town, the prices for imported rice are lower compared to the periodic market in the chiefdom.

Sajad Hussain,
Muzaffargarh District, Pakistan
We can afford two meals a day, no more. We have breakfast and then a hot meal at around 5 pm. We never have meat. At the moment, we can’t afford vegetables either apart from onions. Vegetables, in particular, have become more expensive: they’re not so plentiful any more because of the floods.
Allen Rudlen Eliston Homphriez,
Autonomous Region of the Northern Atlantic, Nicaragua
We exchange the rice and beans we grow for other food, such as sugar, oil, and flour. Every time we have to sell off more of our products to get the same amount of goods in exchange.
Extreme Weather and Climate Change Are Putting Pressure on Agricultural Prices.
Extreme weather events played a role in raising food prices and fueling price volatility in 2007–08 and in 2010. Looking ahead, various climate scenarios predict an increase in variability. Climate change could result in more intense and frequent natural disasters (such as droughts and floods), which could trigger significant yield losses, production cuts, and price increases and lead to higher volatility.
IFPRI simulations show that prices are likely to rise as a result of climate change under both pessimistic and optimistic scenarios of population growth (see figure below). A recent IFPRI study of food security and climate change (Nelson et al. 2010) suggests that in contrast to the 20th century, when real agricultural prices declined, the first half of the 21st century is likely to see increases in real agricultural prices.
Food demand – driven by population and income growth – is rising faster than agricultural productivity, which is hampered by the effects of climate change. In the figure below, income and demographic changes between 2010 and 2050 result in price increases that range from 20.4 percent for rice in the optimistic scenario to 52.4 percent for maize in the pessimistic scenario.
These substantial increases show the underlying pressures on the world food system, even in the unlikely event that perfect mitigation is achieved. With climate change, total price increases will range from 31.2 percent for rice in the optimistic scenario to 106.3 percent for maize in the pessimistic scenario.
About Commodity Futures
A “futures“ contract refers to an agreement between two parties to exchange a specified quantity and quality of a commodity at a specified price on a certain date in the future. Futures trading is used by agricultural producers to reduce the risk they face from changing prices and by speculators to take advantage of price shifts in commodities.
“Open interest” is the total number of outstanding futures contracts held by market participants at the end of each day – that is, contracts that have not yet been offset by an opposite futures position or fulfilled by delivery of the commodity.
Commodity Futures Trading Is Up.
Since 2008, one indication of higher price volatility has been the significant increase in the volume of agricultural commodity futures traded on the Chicago Board of Trade (CBOT), a leading agricultural futures exchange. From 2005 to 2006, the average monthly volume of futures for wheat and maize grew by more than 60 percent, while the volume for rice futures rose by 40 percent. In 2007, traded volumes again rose significantly for wheat, maize, rice, and soybeans – especially soybeans, whose monthly average was 40 percent higher than in 2006 (see figure below).
In all commodities, volumes continued to increase during 2010–11. Moreover, open interest has also been growing in recent years, a trend that may reflect the entry of medium- and long-term speculators into commodity futures markets (see figure on the bottom of page 27). Such speculation may have played a role in the 2007–08 food price crisis (Robles, Torero, and von Braun 2009; Welthungerhilfe 2011).
Speculators normally make short-term investments; as they swarm into a market, they exacerbate the initial increase in price, and when they flee a market, they contribute to a fall in prices. In addition, agricultural commodities (including food products) have recently attracted more investment. They are regarded as a store of wealth that can protect against inflation or deflation of monetary assets, a characteristic that could explain the significant influx of money into index funds that include food commodities. Investment in such funds increased from US$13 billion to US$260 billion between the end of 2003 and March 2008, pushing up the prices of those commodities.
Today’s agricultural markets have three key characteristics that increase price responses to the biofuels, climate change, and commodity trading challenges.
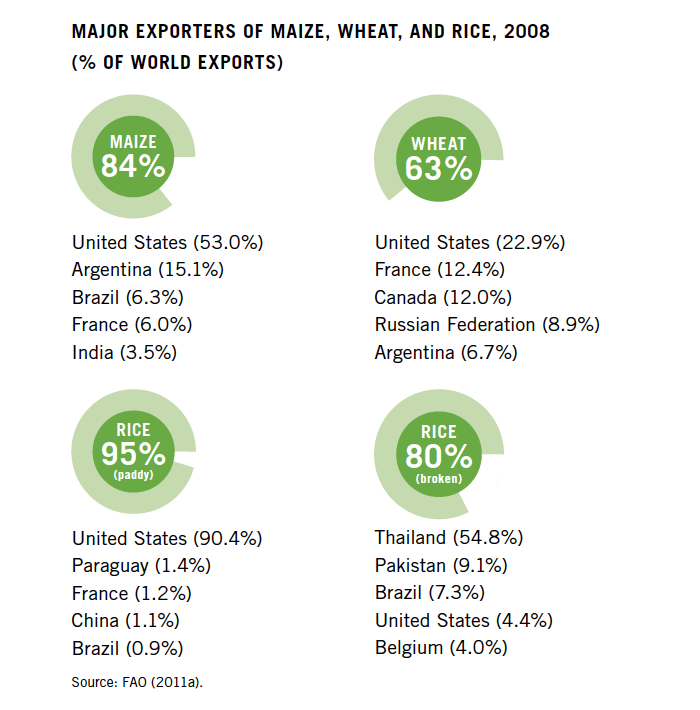
First, export markets for all staple commodities – rice, maize, wheat, and soybeans – are highly concentrated in a few countries or very thin (that is, only a small share of production is traded). In the case of both maize and rice, the top five producers account for more than 70 percent of global production, and the top five exporters account for about 80 percent of world exports (see figure right). For wheat, the top five producers and exporters account for about 50 and 60 percent of global production and exports, respectively.
The United States is by far the largest global supplier of maize, wheat, and paddy rice, as well as the fourth-largest supplier of broken rice. Argentina and France are also among the top suppliers of maize and wheat, and Brazil is among the top producers of maize and rice. China is the largest producer of wheat and paddy rice, as well as the second-largest producer of maize; however, its production is locally oriented. These high levels of concentration imply that the world’s capacity for coping with geographical risk is limited. Any weather shock or exogenous shock to production in these countries will immediately have an effect on global prices and price volatility.
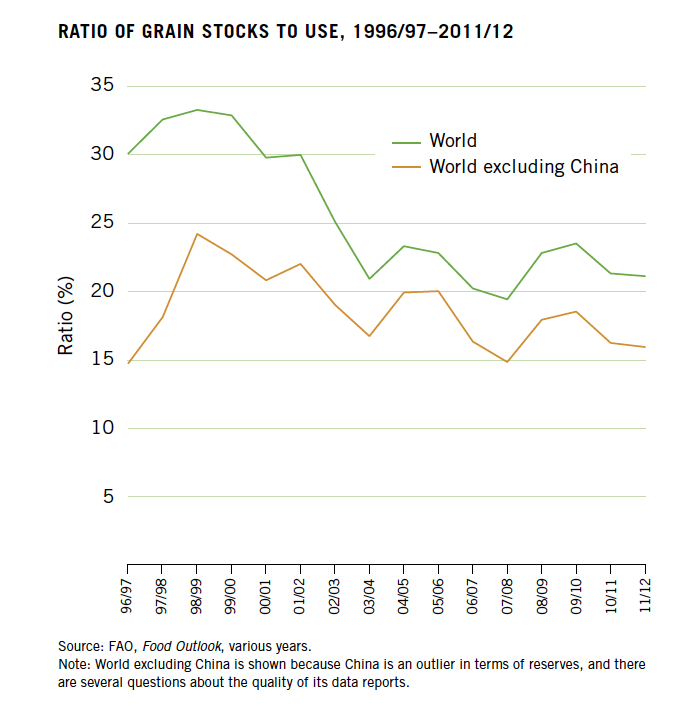
Second, the world’s reserves for maize and restricted reserves for wheat are now at historically low levels (see figure right). To function effectively, the market requires a minimum level of grain reserves to serve as a buffer against sudden changes in supply or demand. These reserves are needed because, in the short term, supply and demand for grain are not very responsive to price. When prices go up, for example, it is difficult for farmers to immediately produce more or for consumers to immediately consume less. As a result, any supply shock, such as a drought or flood, can lead to price spikes and hoarding by farmers seeking to take advantage of higher prices in the future. In both 1973 and 2007 global grain stocks hit record lows, prompting global food crises. Although the difference between too few grain stocks and just enough is relatively small, a lack of sufficient stocks can lead to large price increases and a breakdown of functioning markets. In 2007–08, grain stocks were only about 60 million tons (2.7 percent of global production) less than in 2004–05. But with prices rising sharply in 2007–08, this difference in grain stocks was enough to cause serious problems in the market, especially for commodities such as rice, the production of which is concentrated in just a few countries (Timmer 2010).
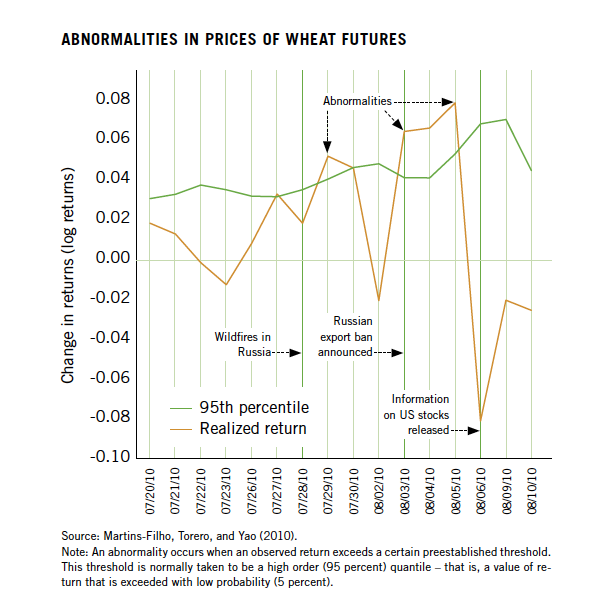
Third, appropriate, timely information on food production, stock levels, and price forecasting is lacking. When this information gap leads to overreactions by policymakers, the result can be soaring prices. IFPRI has developed a way to measure this phenomenon and make it accessible as a useful tool for policy makers. In August 2010, Russia banned wheat exports in response to ongoing drought and wildfires. As the figure (right) shows, in the period in which Russia imposed the export ban, futures returns for wheat showed three days of excessive, or abnormal, returns (that is, returns exceeded the threshold they stay below 95 percent of the time) – even when supply and demand factors suggest they should not have done so. At that time global wheat stocks stood at around 175 million metric tons – nearly 50 million metric tons more than in 2007–08. Russia’s export ban removed less than 18 million metric tons from the market – well below the 26 million metric tons held in reserve by the United States alone. Moreover, the United States – the world’s largest wheat exporter – had enjoyed a good harvest.
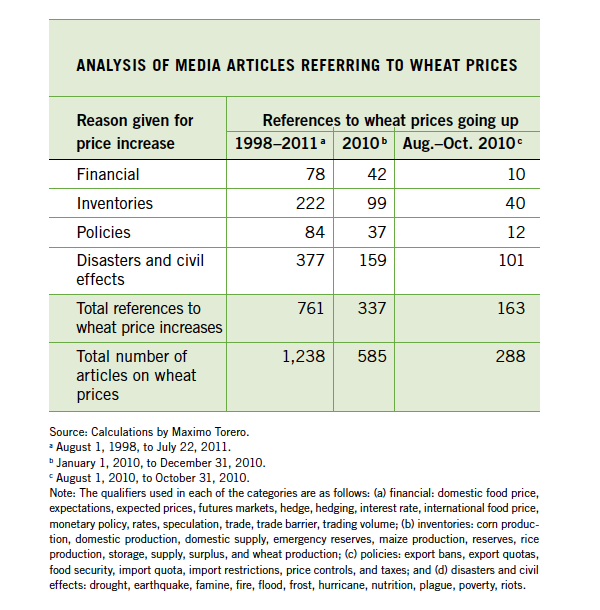
When information on the US harvest and existing stocks became available, prices immediately dropped. US wheat production could easily have covered the gap in exports from Russia, and if this information had been known sooner, global wheat prices should not have increased substantially. The media overreacted to the news of Russia’s export ban and failed to explain that global wheat production and stocks were sufficient to compensate for the loss of Russia’s wheat. Moreover, every piece of news during August through October 2010 – even the US Department of Agriculture’s better-than-expected projection that the world would harvest only 5 percent less wheat that year than the previous one – seemed to elicit a spike. The number of media articles on the price of wheat rose significantly between August and October 2010, and 57 percent of the total number of media articles with any reference to wheat prices reported that wheat prices were going to increase. This number was 93 percentage points higher than the same measure in an average quarter for 2010 (see table right).
Among the major reasons for the price increases reported in the media were the fires in Russia (62 percent) and low inventories because of low production and stocks (25 percent), even though the inventories and stocks were sufficient and significantly higher than in the 2008 crisis. Only 7 percent of articles referred to policies, such as export bans, which had in fact been the major reason for the increase in prices.
This lack of information on global production led governments around the world to engage in panic buying that exacerbated the situation and pushed up prices.
Estimating the Effects of Rising Food Prices and Excessive Volatility on the Poor in Bangladesh, Pakistan, and Vietnam
To examine how much rising food prices and increased price volatility made poor people worse off, IFPRI estimated the impact of price changes between 2006 and 2008 on the welfare of poor people in three countries—Bangladesh, Pakistan, and Vietnam:
-
In both Bangladesh and Pakistan, increasing food prices left an estimated 80 percent of households worse off. In Vietnam, 51 percent of all households were likely worse off, whereas 64 percent of rural households in Vietnam may have been better off.
-
Among households that were worse off, the poorest households were estimated to experience the greatest losses in spending.
-
Households in Bangladesh lost an average of an estimated 11 percent of their household spending; households in Pakistan and Vietnam lost about 5 percent.
-
Increasing food prices caused poverty rates in Bangladesh and Pakistan to rise by an estimated 5 and 2 percent, respectively. In contrast, higher food prices could have reduced poverty in Vietnam by 8 percent because rice producers benefited from higher prices.
-
If countries were to fully compensate the poorest fifth of households for their losses stemming from higher food prices, the cost in Bangladesh would represent an estimated 1.3 percent of total national spending; in Pakistan, 0.67 percent; and in Vietnam, 0.31 percent.
Source: Robles (2010). Note: These estimates are at the microeconomic level and incorporate first-round and substitution effects. The study simulates the real price change of the most important food items in each country between the first quarter of 2006 and the first quarter of 2008.
Food Prices and Calorie Consumption in Seven Latin American Countries
IFPRI studied seven countries in Latin America to examine the impact of food prices on nutrition. Following the 2007–08 food price shock, households reduced their calorie consumption at rates ranging from 0.95 percent to 15.1 percent, with a median reduction of 8.0 percent. The largest reductions took place in Ecuador, Haiti, Nicaragua, and Panama. In five of the seven countries (Ecuador, Haiti, Nicaragua, Panama, and Peru), households moved from above calorie adequacy levels to below those levels due to the food price shock, with the largest changes observed in Ecuador and Peru (13 and 7 percentage points, respectively).
On the other hand, in all countries except Panama, the wealthiest fifth of the population consumed above the calorie adequacy level and increased their calorie consumption by more than 10 percent after the price shock. This situation also raises concerns, given the rising prevalence of overweight in Latin America.
Source: Iannotti and Robles (2011). Note: The effects of food prices on calorie consumption were estimated using nationally representative household budget surveys and data from the ProPAN and US Department of Agriculture food composition databases.
The Impacts of Rising Food Prices and Excessive Volatility on the Poor
Rising food prices and excessive price volatility can affect households differently, depending on whether they are in rural or urban areas or are net consumers or net producers. Higher food prices and excessive volatility can lead to deterioration of diets, as well as significantly erode households’ purchasing power, affecting the purchase of other goods and services essential for health and welfare, including heating, lighting, water, sanitation, education, and healthcare.
The coping mechanisms that poor households use will ultimately determine the severity of the impact of high food prices on their livelihoods and on the well-being of their members in the short, medium, and long term. Similarly, households’ access to social safety nets and other social protection schemes will also be a key determinant of the level of suffering they will experience because of higher food prices. Safety nets in many countries still reach only a small proportion of the poorest population. Ethiopia’s government safety net program, for example, reaches 8 million people but covers only about 25 percent of the country’s poor; in Bangladesh – a country where 25 percent of the population is ultra-poor – roughly 7 percent of the population has access to social protection or safety net programs (von Braun et al. 2008).
To understand the different impacts on households, IFPRI studied changes in (1) how much people spend and (2) how many calories they consume.
Spending Levels.
To measure changes in households’ welfare in the presence of changing food prices, IFPRI determined how much income would need to be transferred to households to keep their members at the same welfare level as they were before the change in food prices during 2007–08. It found that in most net-importing countries, practically all households were worse off and the national poverty rate was increased because of high food prices. If one did not account for substitution of one commodity with another commodity in response to price changes, the poverty rate increased even more. In urban areas, the impact of high food prices was regressive – in other words, the poorest households in urban areas suffered the most when their losses were measured relative to their total expenditures. This clear regressive pattern did not occur in rural areas, where the negative effects were universal given that most rural residents are poor.
Finally, the magnitude of the effects varied across countries and also depended on the degree to which world prices were transmitted to local prices. (For more information on the effects of rising food prices and excessive volatility for households in three countries in Asia, see box on the right.)
Calorie intake.
Besides reducing poor people’s spending, higher food prices have impacts on their calorie intake. IFPRI simulated how a food price shock would affect the quantity of food people consume. In most of the countries analyzed, it was consistently found that the lower a household’s income, the greater the decline in its calorie intake. Households in poor rural areas reduced their calorie consumption as much as or more than those in urban areas. Households already at risk of consuming too few calories were most affected.
In the majority of countries, large reductions in calorie consumption were found in households with children younger than two years of age – a situation that could have harmful long-term consequences for their health and well-being. At the same time, however, wealthier households increased their calorie consumption by consuming cheaper food. (For more information on the effects of rising food prices for households’ calorie consumption in seven Latin American countries, see box right).
Conclusion

Maria Beltran Boveda,
Santiago de Cuba, Cuba
We sell our produce to state collection and distribution centers which we are bound to by contract. We can’t sell wherever we want. We can’t set the prices ourselves either, they’re determined by the state. But the prices we get for our products are not adequate, because the production costs have doubled. We don’t store our products before they’re sold so that we get better prices. Everything we produce is sold immediately.

Florence Muoki,
Makueni District, Kenya
Life is hard and food has become very expensive. We’ve got even less money to support our children with. We plant trees and vegetables that we sell so that we have money to buy food and send our children to school. But now that everything is so expensive, they don’t go to school any more because they have to help grow vegetables at home. We’re totally dependent on rain, but it doesn’t rain regularly any more. As soon as we can grow and sell things, we can send our children to school again. But without rain, we have nothing to eat and no money.
Higher and more volatile prices appear to be here to stay for some time. It is clear that even though many of the world’s poor live in rural areas and are engaged in agricultural production, the price spikes and volatility that have recently occurred in food markets have generally left them worse off. The poorest people bear the heaviest burden from price spikes and swings.
In addition to understanding the factors contributing to this situation, it is crucial to take steps to moderate food price volatility and to help the most vulnerable people achieve food and nutrition security.
Footnotes
- These studies include Sommer and Gilbert (2006); Bakary (2008); Brahmbhatt and Christiaensen (2008); OECD (2008); OECD/FAO (2011); UNCTAD (2008); von Braun (2008a,b,c); von Braun et al. (2008); World Agricultural Outlook Board (2008); Headey and Fan (2010); and HM Government (2010).
- IFPRI researchers made this finding using the MIRAGE global trade model.
- Although biofuel policies are now under some pressure in both Europe and the United States, mandates remain in effect.
- Analysis of the media articles was conducted using Sophic Intelligence Software, which is built on the Biomax BioXMä Knowledge Management Suite. Each day, global food- and commodity-related news articles are loaded into Sophic Intel for linguistic analysis and semantic object network mapping. Sophic Intel generates wiki reports and heat maps based on terms and phrases found in press articles that influence commodity price volatility and food security. The average quarter for 2010 had 84 articles mentioning that wheat prices were increasing, whereas the quarter from August to October 2010 had 163 articles – an increase of 73 percent.
- Our estimates depend on the availability of general consumption and production data, as well as estimates of how households substitute or reallocate their consumption and production decisions in response to price changes.