Uganda
A Closer Look at Hunger and Undernutrition
High Poverty and Low Agricultural Productivity Worsen Hunger and Undernutrition
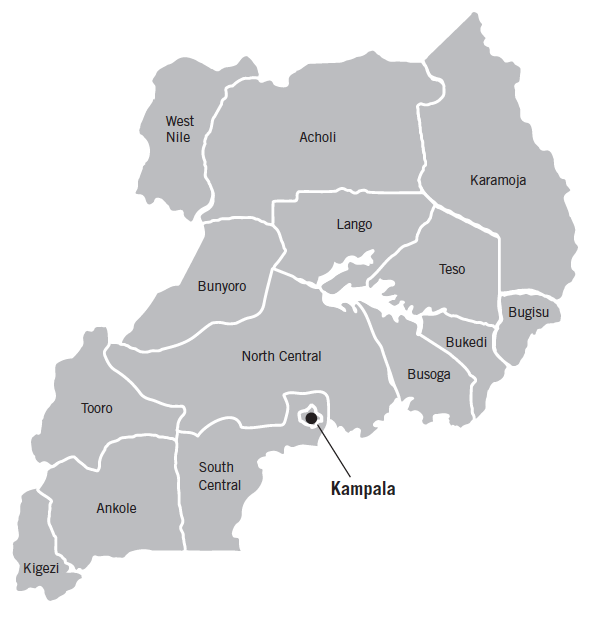
FIGURE 1: MAP OF UGANDA
Classified as a low-income country, Uganda has a fast-growing population and suffers from widespread poverty. Its population, at 43 million people in 2017, is growing at 3.3 percent per year and is expected to exceed 100 million by 2050 (UN DESA Population Division 2017). Uganda’s poverty rate in 2016 was 41.6 percent, down from more than 60 percent in the 1990s, but with some fluctuation in recent years. Its GDP per capita in 2017 was just $606 in current US dollars, much less than half of the average for Africa south of the Sahara, which stands at $1,574 (Word Bank 2019).
Agriculture plays a vital role in the Ugandan economy. Sixty-eight percent of Ugandans are employed in agriculture, 7 percent in industry, and 25 percent in services. Meanwhile, 25 percent of GDP comes from agriculture, 20 percent from industry, and 47 percent from services (World Bank 2019). Coffee has historically been the country’s biggest export product, although it was surpassed by gold for the first time in 2018 (BOU 2019). Uganda has high levels of biodiversity, rich volcanic soils, multiple freshwater lakes with irrigation potential, and two rainy seasons per year, which are beneficial to agricultural production. Yet agriculture in Uganda has been plagued by droughts and damaging diseases and pests. To raise productivity and improve food security, Uganda will need to boost extension services and farmers’ use of inputs and reduce their postharvest losses (World Bank 2018).
Uganda has received significant numbers of refugees in recent years, with the total refugee population increasing from approximately 200,000 in 2012 to more than 1.2 million currently. Refugees come primarily from neighboring South Sudan and the Democratic Republic of the Congo (UNDP 2017; UNHCR 2019). Uganda has an exceptionally welcoming approach to refugees, and the United Nations High Commissioner for Refugees has touted its policies toward refugees as some of the most progressive in the world (UNHCR 2018). In contrast to many countries, where refugees are often relegated to refugee camps, in Uganda refugees are given a plot of land and access to services such as healthcare and education and are integrated into the community. However, with limited resources and concerns about mismanagement of funds, Uganda increasingly struggles to provide for its growing refugee population (CSIS 2018).
Uganda has been relatively peaceful and stable in the recent past, although the country has experienced multiple rebellions in the north of the country, including most notably the violent and terrorizing presence of the Lord’s Resistance Army between 1987 and 2006 (Souaré 2009; HRW 2012). The Democracy Index classifies Uganda as a “hybrid regime,” with substantial irregularities in elections preventing them from being considered free and fair (EIU 2018).
Hunger and Undernutrition in Uganda
For each country, GHI scores are calculated based on values of four component indicators:
- UNDERNOURISHMENT: the share of the population that is undernourished (that is, whose caloric intake is insufficient);
- CHILD WASTING: the share of children under the age of five who are wasted (that is, who have low weight for their height, reflecting acute undernutrition);
- CHILD STUNTING: the share of children under the age of five who are stunted (that is, who have low height for their age, reflecting chronic undernutrition); and
- CHILD MORTALITY: the mortality rate of children under the age of five (in part, a reflection of the fatal mix of inadequate nutrition and unhealthy environments).
FIGURE 2: UGANDA’S GLOBAL HUNGER INDEX SCORES AND INDICATOR VALUES, 2000, 2005, 2010, AND 2018
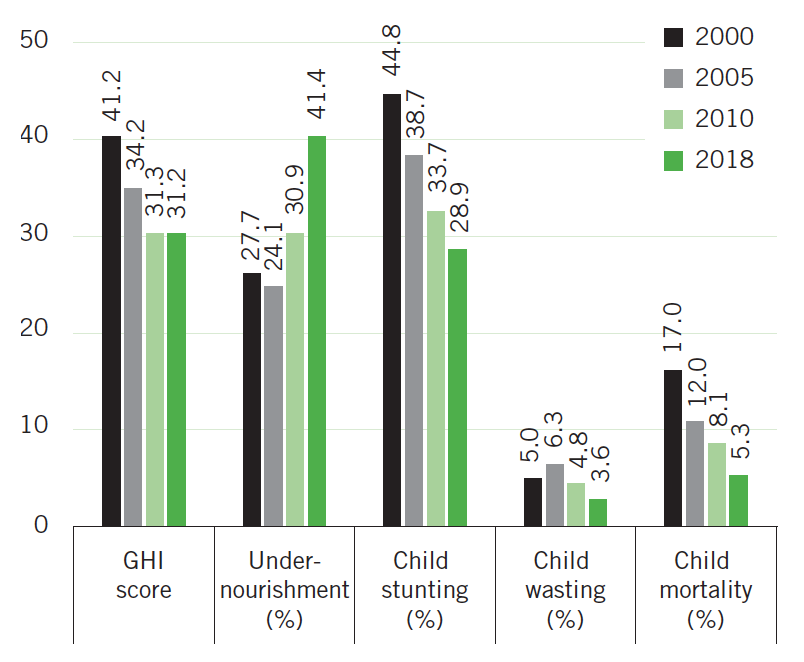
Note: Undernourishment values refer to the prevalence of undernourishment for the country’s population as a whole; child stunting, child wasting, and child mortality refer to the rates for each indicator for children under the age of five. Data for GHI scores, child stunting and child wasting are from 1998–2002 (2000), 2003–2007 (2005), 2008–2012 (2010), and 2013–2017 (2018). Data for undernourishment are from 1999–2001 (2000), 2004–2006 (2005), 2009–2011 (2010), and 2015–2017 (2018). Data for child mortality are from 2000, 2005, 2010, and 2016 (2018). See Appendix A in the 2018 GHI report for the formula for calculating GHI scores and Appendix B for the sources from which the data are compiled.
Uganda’s 2018 GHI score is 31.2, on the upper end of the serious category. This reflects an improvement relative to its 2000 and 2005 GHI scores (41.2 and 34.2 respectively) yet is virtually unchanged relative to its 2010 GHI score of 31.3 (Figure 2). Uganda ranks 105th out of 119 countries with 2018 GHI scores.
In terms of the indicators used to calculate GHI scores, Uganda’s 2015–2017 undernourishment rate — used in its 2018 GHI score — is 41.4 percent and has risen steadily since 2004–2006, indicating an increasing proportion of the population that is not able to meet minimum calorie requirements on a regular basis. Uganda has historically experienced periodic droughts, which affect agricultural production and food security, and these have become more frequent as a result of global climate change (OPM GOU 2012). In 2015/2016, a severe drought associated with El Niño affected much of East Africa and sharply increased food insecurity in Uganda into 2017 (OPM GOU 2017). Karamoja, one of the poorest and most food-insecure regions of Uganda and long reliant on donor food assistance, was particularly hard hit by the recent drought and continues to have the highest level of food insecurity of any region in Uganda (FEWS NET 2016, 2017, 2019).
Uganda’s child undernutrition levels and child mortality rate have declined in recent years (see Figure 2). According to the latest survey data, Uganda’s child stunting rate is 28.9 percent and its child wasting rate is 3.6 percent, down from 44.8 percent and 5.0 percent in 2000–2001, respectively. Uganda’s child mortality rate is 5.3 percent, down from 17.0 percent in 2000. Child undernutrition in Uganda is caused by a variety of factors including a high disease burden, inadequate maternal and child care practices, poor access to safe water, suboptimal sanitation and hygiene practices, and underlying environment and policy factors (FTF 2018). A study in rural Uganda, Ankole region, found that the main predictors of stunting were low access to appropriate complementary diets, the sex of the child (with boys more likely to be stunted than girls), food insecurity, low knowledge about stunting by the primary caregiver, and poor socioeconomic status (Bukusuba, Kaaya, and Atukwase 2017). WHO and UNICEF recommend exclusive breastfeeding up to 6 months of age, and in Uganda 66 percent of children under 6 months are exclusively breastfed—a rate that has changed fairly little since 2000. For children aged 6–23 months, just 15 percent receive a minimum acceptable diet, representing an improvement from a dismally low proportion of only 6 percent in 2011 (UBOS and ICF 2012, 2018).
At the regional level, there is substantial variation in children’s nutritional status. The highest regional stunting rate, at 40.6 percent, is in Tooro region in the west of the country, and the highest regional wasting rates—10.4 percent in West Nile and 10.0 percent in Karamoja—are in the north (Table 1). Karamoja’s high wasting rate can be explained at least in part by its high levels of poverty, food insecurity, and childhood diseases, while the high wasting rate in West Nile may be influenced by its large refugee population, which has high rates of child undernutrition (Buzigi 2018). Tooro region is not particularly poor relative to other regions of Uganda, nor has it been as vulnerable to drought as other regions (UBOS and ICF 2018; Groen and Jacobs 2012). Tooro does, however, fare poorly in terms of infant and young child feeding practices: out of 15 regions, it has the second-lowest rate of children aged 6–23 months who receive a minimum acceptable diet (UBOS and ICF 2018). In the southwest of the country, shortfalls in the water, sanitation, and hygiene environment combine with poor child feeding practices to create nutritional challenges despite relatively high levels of access to food of adequate quantity and quality (FTF 2018).
The typical diet in Uganda is relatively low in dietary diversity and micronutrient-rich foods. A study in Kampala and two rural regions in southwestern and northern Uganda revealed substantial variation in food and micronutrient intakes across regions. It also showed widespread inadequacies in people’s intakes of vitamin A, vitamin B-12, iron, zinc, and calcium—micronutrients for which foods of animal origin are good sources (Harvey, Rambeloson, and Dary 2010). A study in Kiboga district, North Central region, found that the study population’s diet was high in white roots, tubers, and bananas and low in other fruits and vegetables and animal-source foods (Nabuuma, Ekesa, and Kennedy 2018). In urban Uganda, fruit and vegetable consumption is low and is influenced much more by educational status than by household income, suggesting that more should be done to raise awareness of the importance of fruit and vegetable consumption (Madhavan-Nambiar et al. 2015). An analysis of the diets of pastoralist and agro-pastoralist households in the cattle corridor, North Central region, found that meat, poultry, and eggs were consumed infrequently even among pastoralist households (Mayanja et al. 2015).
There is evidence that poor water, sanitation, and hygiene conditions compromise children’s nutritional status, most likely through negative impacts on their health and their ability to properly absorb nutrients (Fink, Günther, and Hill 2011; Ngure et al. 2014). Whereas 78 percent of Ugandan households have access to an improved source of drinking water, just 19 percent of households use improved toilet facilities (UBOS and ICF 2018).
Interventions That Affect Food Insecurity and Undernutrition
Table 1
GHI INDICATOR VALUES BY REGION, UGANDA
| Region | Child stunting (%) | Child wasting (%) | Child mortality (%) |
|---|---|---|---|
| South Central | 26.5 | 1.1 | 5.9 |
| North Central | 28 | 2.3 | 7.4 |
| Kampala | 18.1 | 3.9 | 6.4 |
| Busoga | 29 | 3.6 | 8.4 |
| Bukedi | 22.8 | 2.8 | 7.2 |
| Bugisu | 36 | 5 | 6.8 |
| Teso | 14.3 | 2.2 | 5.4 |
| Karamoja | 35.2 | 10 | 10.2 |
| Lango | 22.3 | 5 | 6.8 |
| Acholi | 30.6 | 3.9 | 6.9 |
| West Nile | 33.9 | 10.4 | 8.6 |
| Bunyoro | 34.5 | 2.3 | 8.9 |
| Tooro | 40.6 | 3.4 | 8.1 |
| Kigezi | 30.7 | 3.7 | 6.7 |
| Ankole | 29.3 | 1.8 | 7.2 |
| Total | 28.9 | 3.5 | 7.3 |
|
Source: UBOS and ICF (2018). Note: All indicators are for children under five years of age. Undernourishment values at the subnational level are not currently available for Uganda. The total child wasting rate listed here is slightly different from that listed in Figure 2 because the wasting prevalence as reported in UBOS and ICF (2018) was minimally revised when it was included in UNICEF, WHO, and World Bank (2018), the source for the child wasting and stunting rates for GHI scores and Figure 2. For child mortality data, UBOS and ICF (2018), which contains subnational values for the 10-year period preceding the survey in 2016, is cited here and was used by the authors to calculate the national total, while UN IGME (2017), which includes estimates for single calendar years, is cited in Figure 2 and used for the calculation of GHI scores. |
|||
Researchers have conducted a range of studies to assess the effectiveness of efforts to reduce hunger and undernutrition. The following is a selection of studies that demonstrate the types of nutrition-specific interventions, such as breastfeeding promotion and supplementation programs, and nutrition-sensitive interventions, such as agricultural programs to produce micronutrient-rich foods, that have been shown to reduce hunger and/or undernutrition specifically in the context of Uganda.
A number of interventions designed to improve the diets and nutrition of infants and children have proven successful. A program promoting exclusive breastfeeding (EBF) of infants that included peer counseling for mothers before and after giving birth resulted in increased rates of EBF for participating mother-child pairs compared with the control group (Tylleskär et al. 2011). An NGO-run infant and young child feeding program in western Uganda, Byokulia Bisemeye mu Bantu, provided the caregivers of underweight young children ages 6–59 months with nutrition education regarding children’s dietary needs, a lipid-based nutrient supplement, and growth monitoring for children. Compared with children in a control group, participating children had greater dietary diversity and were fed more frequently. Caregivers also demonstrated greater knowledge of children’s nutritional needs even after their participation in the program had ended (Ickes et al. 2017). A pilot of an in-school program in northern Uganda provided children ages 6–8 with two, one, or no hard-boiled eggs five days a week over six months; the children who received two eggs had greater growth, including height and weight, than children who received just one egg or no eggs (Baum, Miller, and Gaines 2017).
Agricultural interventions also have the potential to improve food and nutrition security. A large-scale program promoting the production and consumption of vitamin A–rich orange-fleshed sweet potatoes among rural farm households in Central and Eastern Uganda increased vitamin A intake among women and children and improved vitamin A status for children. The program included agricultural and nutritional training, as well as strategies for marketing the crops (Hotz et al. 2012). A large-scale agricultural extension program in Uganda operated by the NGO BRAC provided smallholder women farmers with improved access to seeds for high-yielding varieties and training in agricultural methods. Households in the program area experienced greater improvements in several measures of diet quantity and quality, relative to the control group, most likely because participating households adopted inexpensive farming methods that increased agricultural output (Pan, Smith, and Sulaiman 2018). A study found that farmers who own improved breeds of dairy cows had higher milk yields, sales, and intake than farmers who own local indigenous dairy cows, and children in the households with improved breeds had better nutritional status as measured by their height for age (Kabunga, Ghosh, and Webb 2017). An estimate of the effects of adopting improved bean varieties at the national level shows that adoption of improved beans increased households’ dietary diversity scores and food security in Uganda (Larochelle et al. 2015).
Social protection programs, and specifically cash transfer programs, are commonly implemented throughout the developing world. Between 2011 and 2015, the Government of Uganda reached about 560,000 people through its Social Assistance Grants for Empowerment (SAGE) program, a cash transfer program targeted to vulnerable families and the elderly. Program beneficiaries had higher food expenditures than a comparable control group, the elderly reported fewer episodes of hunger, and vulnerable families had greater dietary diversity and consumed protein- and micronutrient-rich foods more often. There was no effect, however, on child nutrition (Merttens et al. 2015; Merttens et al. 2016). A program supported by UNICEF and the World Food Programme provided households with children in preschool in Karamoja with either a cash transfer or an enriched food ration (corn-soy blend fortified with multiple micronutrients). Children whose families received the cash transfer experienced improved diet quality (they consumed more meat, eggs, and dairy); improved hygiene (through more latrines and hand-washing facilities in community-funded preschools); and lower incidence of diarrhea, intestinal worms, and anemia. These children also showed improved cognitive function. These improvements were not observed in the control groups or in children whose families received the food rations, perhaps because corn-soy blend was not considered desirable, which meant that families could not sell it in the market or use it to support the preschool (Gilligan and Roy 2016).
Existing Policies and Government Measures Affecting Food Security and Nutrition
-
Uganda’s Second National Development Plan (NDPII, 2015/16– 2019/20) highlights the country’s commitment to “end hunger, achieve food security and improved nutrition” (GoU 2015, 96). It includes a target of reducing stunting to 25 percent by 2019/2020 and eliminating all stunting by 2040.
-
The Uganda Food and Nutrition Policy (UFNP, 2003) aims to promote the nutritional status of all Ugandans through coordinated multisectoral interventions focused on food security, improved nutrition, and increased incomes (GoU 2003).
-
The Uganda Nutrition Action Plan (UNAP, 2011–2016) recognizes the multidimensional nature of malnutrition and emphasizes the need for multisectoral coordination in addressing malnutrition (GoU 2011). The goal of the UNAP is “to improve the nutrition status of all Ugandans, with special emphasis on women of reproductive age, infants, and young children” (GoU 2011, iii). The successor to the UNAP—the National Nutrition Strategy and Investment Plan (NNS-IP)—is in the development stages (SUN 2018; Turcan and Bene 2017).
-
The National Agriculture Policy (2013) seeks to promote food and nutrition security and improve household incomes by enhancing sustainable agricultural productivity, providing employment, and promoting trade. It states the importance of ensuring adequate caloric intake for the population, improving production and consumption of diverse and nutritious foods, and improving children’s nutritional status (GoU 2013).
-
The objective of the Agriculture Sector Strategic Plan II (2015– 2020) is to transform Uganda’s agricultural sector from subsistence farming to commercial agriculture and create employment, increase household incomes, and ensure household food security. However, nutrition is not a major focus (Turcan and Bene 2017).
-
Uganda has instituted various policies and programs aimed at climate change adaptation and mitigation, including the National Climate Smart Agriculture Framework Programme, the agricultural sector’s National Adaptation Plan, and the National Climate Change Policy (Irish Aid 2018).
-
Additional policies with the potential to affect food and nutrition security include the National Social Protection Policy (2015), the National Health Policy (2010–2020), and the National Integrated Early Childhood Development Policy and Action Plan (2016) (Turcan and Bene 2017).
Recommendations for Moving Forward
-
Given the importance of proper nutrition early in life and the lifelong consequences of undernutrition in children, it is critical that the government and donors prioritize interventions to improve children’s nutrition. This may require providing caregivers with nutrition education and behavior change communication on proper infant and young child feeding practices; improving access to nutritious foods for pregnant women, mothers, and children; and improving healthcare services and the water, sanitation, and hygiene environment to reduce infections and infestation with parasites. The needs of subgroups within the Ugandan population vary, and decisions about the choice of programs and policies for any given target group should be guided by demographic and subnational data to determine the constraints and barriers to good nutrition.
-
Many sectors—agriculture, health, social protection, and others—influence a country’s success, or lack thereof, in improving nutrition. Although the importance of a multisectoral approach to nutrition has been well acknowledged in Ugandan policies, these sectors still need to incorporate nutrition more deeply into their missions and activities. To this end and to ensure greater shared accountability for nutrition, evaluations of the relevant ministries and agencies must include measures of progress on nutrition (Turcan and Bene 2017).
-
In some areas additional support for nutrition is needed at the district and subdistrict levels. This support might include increasing training for district leaders so that they may become champions for action on nutrition; incorporating nutrition into existing district-level programs such as agricultural extension and social protection; and increasing the availability of district-level data to guide and evaluate nutrition programming (Agaba, Ghosh, and Griffiths 2017).
-
The African Union’s Maputo Declaration of 2003 and Malabo Declaration of 2014 set targets for agricultural growth and transformation, including commitments to end hunger in Africa by 2025 and to allocate at least 10 percent of public expenditure to agriculture (AU 2014). In the 2018/19 budget, the Ugandan government allocated just 3.8 percent of the national budget to agriculture (AU 2014; Namagembe 2018). Increased expenditure on agriculture is needed to improve the quantity, quality, and sustainability of food production. Also, higher levels of staffing at government agencies and ministries are needed to implement and coordinate agricultural policies and programs (FTF 2018).
-
Additional measures must be taken to increase the productivity and resilience of refugee populations. Such measures include improving tenure security; providing increased technical assistance in farming; increasing the availability of veterinary care to enhance the benefits of livestock keeping by refugees and minimize the risks of livestock disease; and improving the provision of basic services such as water, sanitation, hygiene, and healthcare for refugee and host communities (FAO 2018).
Footnotes
- The poverty rates expressed here are poverty headcount ratios at $1.90 per day (2011 purchasing power parity).
- Black et al. (2013) estimate that undernutrition causes almost half of all child deaths globally.
- Wamani et al. (2007) show that stunting rates are higher for boys than girls in much of Africa south of the Sahara and suggest that the explanations may be biological, evolutionary, or societal, though they consider the latter somewhat unlikely.
- A “minimum acceptable diet” is a standard that combines minimum dietary diversity and minimum meal frequency, with different recommendations for breastfed and non-breastfed children, who need to receive milk or milk products as a substitute for breast milk.
- The authors note that their survey method, 24-hour recall, may not have adequately captured meat consumption on special occasions, especially among pastoralist households.
- The prevalence of underweight among children who had participated in the program was significantly higher than the prevalence of underweight among children in the control group. This difference probably reflects the original enrollment criteria of the program, which recruited children based on their underweight status, and the challenge of reversing growth deficits after the age of 24 months (Ickes et al. 2017).
- The number of women with vitamin A deficiency at baseline was unexpectedly low, resulting in insufficient statistical power to show a significant impact on women’s vitamin A status.
Authors
Jill Bernstein and Doris Wiesmann