Kenya
A Closer Look at Hunger and Undernutrition
A Mixed Picture: Poverty Reduction, Rapid Population Growth, and Extreme Weather
FIGURE 1: MAP OF KENYA’S REGIONS AND COUNTIES
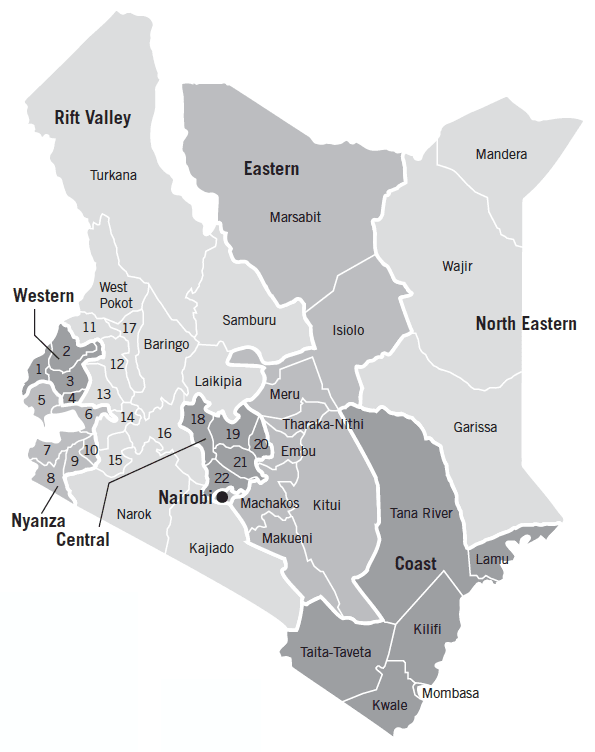
1. Busia
2. Bungoma
3. Kakamega
4. Vihiga
5. Siaya
6. Kisumu
7. Homa Bay
8. Migori
9. Kisii
10. Nyamira
11. Trans-Nzoia
12. Uasin Gishu
13. Nandi
14. Kericho
15. Bomet
16. Nakuru
17. Elgeyo-Marakwet
18. Nyandarua
19. Nyeri
20. Kirinyaga
21. Murang’a
22. Kiambu
Note: Kenya was previously divided into 8 administrative provinces but switched to a system of 47 counties in 2013. Much of the sub-national data used here is at the level of the former provinces. Following the convention used in KNBS et al. (2015), this report refers to these former provinces as “regions.”
With a poverty rate below the average for Sub-Saharan Africa, Kenya is making headway on reducing the share of its population living in poverty. In 2015 Kenya had an estimated poverty rate of 36.8 percent, down from 43.7 percent in 2005 (World Bank 2018a). A lower-middle-income country, Kenya had a GDP per capita of $1,508 in 2017 in current US dollars, and between 2007 and 2017 its GDP per capita grew by an average of 2.4 percent a year (World Bank 2018a).
Yet the country’s rapid population growth led to a rise in the absolute number of people living in poverty from 2005 to 2015. And its poverty rate is less responsive economic growth than that in other comparable countries, pointing to the need for more inclusive growth in the future (World Bank 2018b).
Agriculture, fisheries, and forestry are a vital part of Kenya’s economy. In 2017, they made up 38 percent of total employment and 32 percent of the country’s GDP, and growth in the agricultural sector accounted for the largest share of poverty reduction (World Bank 2018b). Services and industry constitute 45 percent and 18 percent of GDP, respectively (World Bank 2018a). The country’s farmers, however, face a major challenge stemming from rapid population growth, which puts downward pressure on the average size of land parcels available to each farmer (FAO 2018b).
Extreme weather also imposes heavy burdens on Kenya’s population. More than 80 percent of Kenya is considered arid or semiarid land, and 95 percent of crops are rain-fed, leaving farmers highly vulnerable to the effects of drought (REGLAP 2012; WFP 2018; Welborn 2018). Internal and cross-border displacement is common in Kenya, in part brought on by drought and conflict over natural resources, creating additional struggles for the affected populations (UN OCHA 2017). Flooding also poses a challenge: in the first half of 2018 alone, flooding displaced more than 300,000 people as well as damaging crop-land and livestock (IDMC 2018; Relief Web 2018).
Hunger and Undernutrition Vary Widely by Region and County
For each country, GHI scores are calculated based on values of four component indicators:
- UNDERNOURISHMENT: the share of the population that is undernourished (that is, whose caloric intake is insufficient);
- CHILD WASTING: the share of children under the age of five who are wasted (that is, who have low weight for their height, reflecting acute undernutrition);
- CHILD STUNTING: the share of children under the age of five who are stunted (that is, who have low height for their age, reflecting chronic undernutrition); and
- CHILD MORTALITY: the mortality rate of children under the age of five (in part, a reflection of the fatal mix of inadequate nutrition and unhealthy environments).
FIGURE 2: KENYA’S GLOBAL HUNGER INDEX SCORES AND INDICATOR VALUES, 2000, 2005, 2010, AND 2018
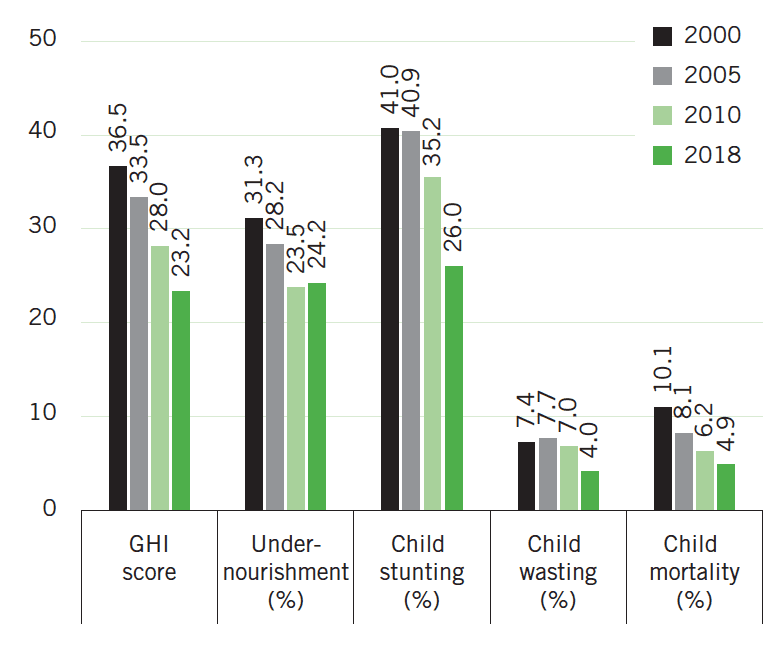
Note: Undernourishment values refer to the prevalence of undernourishment for the country’s population as a whole; child stunting, child wasting, and child mortality refer to the rates for each indicator for children under the age of five. Data for GHI scores, child stunting and child wasting are from 1998–2002 (2000), 2003–2007 (2005), 2008–2012 (2010), and 2013–2017 (2018). Data for undernourishment are from 1999–2001 (2000), 2004–2006 (2005), 2009–2011 (2010), and 2015–2017 (2018). Data for child mortality are from 2000, 2005, 2010, and 2016 (2018). See Appendix A in the 2018 GHI report for the formula for calculating GHI scores and Appendix B for the sources from which the data are compiled.
Kenya’s 2018 GHI score is 23.2, on the low end of the serious category. This is a considerable improvement from 2000, when Kenya’s score was 36.5, considered alarming. Kenya has the lowest 2018 GHI score of any country in East Africa, with the exception of the small-island nation of Mauritius, the only upper-middle-income country in the region.
At the national level, there has been a decline in each of the GHI indicators since 2000 (Figure 2). The mortality rate of Kenyan children under age five has fallen steadily since 2000 (UN IGME 2017). Kenya’s undernourishment rate, reflecting the share of the population without adequate consumption of calories, declined consistently between 2001–2003 and 2013–2015 but has risen since then (FAO 2018b). This increase coincides with the 2016–2017 drought that plagued Kenya and neighbouring countries, sparking drops in agricultural production and increases in food prices (FEWS NET 2017a, 2017b). Kenya’s child stunting and child wasting rates have also fallen considerably. Between 2008–2009 and 2014, the stunting rate dropped from 35.2 to 26.0 percent and the wasting rate fell from 7.0 to 4.0 percent (KNBS and ICF Macro 2010; KNBS et al. 2015).
Rates vary substantially between regions and counties, however, with some still having values significantly higher than the national averages. The highest stunting rates are in Kitui County at 45.8 percent and West Pokot County at 45.9 percent (KNBS et al. 2015). Although these counties have high poverty rates (48 and 57 percent, respectively, based on national poverty lines), stunting in Kenya is not perfectly associated with poverty levels. Rather, it is influenced by a complex set of factors, such as dietary diversity, feeding and care-giving practices, access to adequate sanitation, and disease (KNBS 2018; Eberwein et al. 2016). Wasting is highest in Kenya’s northernmost counties: 22.9 percent in Turkana, 16.3 percent in Marsabit, 14.8 percent in Mandera, 14.3 percent in West Pokot, and 14.2 percent in Wajir (KNBS et al. 2015). These counties are arid or semi-arid, are dominated by pastoralism, and have high rates of poverty (Krätli and Swift 2014; KNBS and SID 2013). Moreover, rates of contraception use and women’s education levels in these counties are low and fertility rates are high (KNBS et al. 2015).
Indeed, children’s nutritional status is also associated with mothers’ education and literacy rates (Ruel, Alderman, and Maternal and Child Nutrition Study Group 2013), both globally and in Kenya specifically. A study from urban settlements of Nairobi finds that maternal education strongly predicts children’s nutritional status, even when controlling for other socioeconomic and demographic factors (Abuya, Ciera, and Kimani-Murage 2012). The latest data from Kenya show that the stunting rate of children whose mothers have had no formal education was 31 percent, while that of children whose mothers have had secondary education or higher was just 17 percent (KNBS et al. 2015). Children’s nutrition is also associated with mothers’ nutritional status. A study from rural Kenya showed a positive correlation between maternal nutrition and children’s nutritional status in terms of anthropometric measures (Gewa, Ottugu, and Yandell 2012).
As Kenya attempts to further reduce child under-nutrition and improve the situation in the counties with persistent challenges, it will be crucial to address infant and young child feeding practices. Breastfeeding practices have improved substantially in Kenya, with 61 percent of children under 6 months exclusively breastfed in 2014, compared with just 32 percent in 2008–09 (KNBS et al. 2015; KNBS and ICF Macro 2010). Meanwhile just 22 percent of children between 6 and 23 months of age receive a minimum acceptable diet (KNBS et al. 2015).
Finally, although most food and nutrition analyses of Kenya have traditionally focused on rural areas, where rates of child under-nutrition tend to be higher than in urban areas, Kenya’s population is increasingly urban, and urban food insecurity and under-nutrition are rising concerns (KNBS et al. 2015; WFP 2010; Concern Worldwide 2017). Urban dwellers are highly vulnerable to food price spikes, which affects their access to food. In addition, urban populations are subject to illness and disease and may lack adequate water, sanitation, and hygiene (WFP 2010; Concern Worldwide 2017). Moreover, child mortality declined much more slowly in urban than in rural areas of Kenya between 1993 and 2008, perhaps because of the deplorable living conditions in urban settlements (Kimani- Murage et al. 2014). In 2014, Nairobi had the second-highest child mortality rate among Kenya’s regions (Table 1).
What Has Worked in Addressing Food Insecurity and Under-nutrition
Table 1
GHI INDICATOR VALUES BY REGION, KENYA
| Region | Child stunting (%) | Child wasting (%) | Child mortality (%) |
|---|---|---|---|
| Coast | 30.8 | 4.5 | 5.7 |
| North Eastern | 24.7 | 13.3 | 4.4 |
| Eastern | 30.1 | 4.4 | 4.5 |
| Central | 18.4 | 2.3 | 4.2 |
| Rift Valley | 29.8 | 5.7 | 4.5 |
| Western | 25.2 | 1.9 | 6.4 |
| Nyanza | 22.7 | 2.0 | 8.2 |
| Nairobi | 17.2 | 2.5 | 7.2 |
| Total | 26.0 | 4.0 | 5.2 |
|
Source: KNBS et al. (2015); see p. 162 for stunting and wasting rates by county. Note: All indicators are for children from age zero to five. Undernourishment values at the sub-national level are not currently available for Kenya. The national child mortality estimates here and in Figure 2 differ because data for 2014 from KNBS et al. (2015), which contains sub-national values, are cited here, while data for 2016 from UN IGME (2017), cited in Figure 2, are used to calculate the 2018 GHI scores. |
|||
Agriculture is considered to have considerable potential to increase household food security and nutrition. Although evidence on the impact of agricultural technologies on relevant outcomes is limited (Kabunga, Dubois, and Qaim 2014), some studies show promising results in Kenya.
A program in western Kenya promoting the production of orange-fleshed sweet potatoes, which are high in vitamin A, led to increased consumption of vitamin A–rich foods when combined with nutrition education and counselling (Hagenimana et al. 2001). A study conducted in Kenya’s Central and Eastern provinces showed that banana tissue culture, a propagation technique that reduces the transfer of pests and disease to banana plants, increased household food security as measured by the Household Food Insecurity Access Scale (Kabunga, Dubois, and Qaim 2014). Small-scale vegetable farmers who sold produce to supermarkets consumed more calories and micro-nutrients than other farmers, owing to increased income and higher vegetable production and consumption (Chege, Andersson, and Qaim 2015). A project promoting soil fertility management techniques increased crop yields and food security for participants, as measured by an increase in the number of months that food stayed in storage, relative to a control group (Wanyama et al. 2010).
Smallholder dairying and pastoralism play an important role in Kenya, with significant implications for nutrition. Roughly a quarter of Kenyan households engage in small-scale dairy activities. A detailed study of pastoralism in four of Kenya’s northern, arid counties—Mandera, Marsabit, Turkana, and Wajir—showed that livestock is the main source of livelihood for at least 57 percent of the households in these counties (Njuki et al. 2016; Krätli and Swift 2014). For pastoralist households in Kenya, animal ownership is associated with household milk consumption, and as livestock holdings decrease, so does milk consumption. Milk consumption at the household level is positively associated with higher body mass index values among youth (Iannotti and Lesorogol 2014). Consumption of animal-source foods by Kenyan schoolchildren has also been shown to be positively associated with height and weight gains (Grillenberger et al. 2006). A school-feeding program that tested the effect of different types of snacks given to children found that meat and milk snacks contributed the most to children’s arm muscle growth (Neumann et al. 2013).
In the early 2000s, Kenyan dairy policy was revised to accommodate the needs and interests of small-scale producers (Kaitibie et al. 2010). The Smallholder Dairy Commercialization Program provided training to help small-scale dairy farmers improve their productivity and marketing skills. Participating households had better food security than households in the control group: they consumed more foods rich in micro-nutrients and protein, such as red meat, milk and dairy, and pulses (Bonilla et al. 2018). However, there is reason to exercise caution—in households with diseased livestock, child growth was lower than in households with healthy livestock, suggesting that in some cases livestock ownership has both positive and negative effects (Mosites et al. 2016).
Kenya is also home to a number of cash transfer programs— increasingly common in developing countries—that show evidence of positive impacts on food security. The unconditional cash transfer program Cash Transfer for Orphans and Vulnerable Children (CT-OVC) increased households’ food expenditures, dietary diversity (Ward et al. 2010), and consumption of food produced by households themselves (Asfaw et al. 2014). The NGO GiveDirectly’s unconditional cash transfer program in rural Kenya also increased households’ food security and food expenditures, particularly when the transfers were made monthly rather than in a lump sum (Haushofer and Shapiro 2016). Kenya’s Hunger Safety Net Programme, another unconditional cash transfer program, boosted beneficiaries’ food consumption relative to controls and increased dietary diversity for poorer households in the project (Merttens et al. 2013; OPM and IDS 2012).
Nutrition education can help improve diet quality for children and adults in Kenya as well. A pilot project in western Kenya found that providing nutrition education to fathers and grandmothers on proper complementary feeding practices for young children raised social support for mothers and improved some types of child feeding practices (Mukuria et al. 2016).
Existing Policies and Government Measures Affecting Food Security and Nutrition
-
The Constitution of Kenya, 2010, states that every person has the right to be free from hunger and to have adequate food of acceptable quality (GoK 2010b).
-
One of President Uhuru Kenyatta’s “Big Four” priorities is to achieve food and nutrition security by 2022, in part by raising agricultural productivity and targeting small-scale farmers with new technologies (GoK 2018).
-
The national Food and Nutrition Security Policy (FNSP, 2011) integrated nutrition into national food security policy and described the actions needed to achieve sufficient, sustainable, and nutritious food production (Mugambi, Volege, and Gichohi 2017).
-
The National Nutrition Action Plan, 2012–2017, was designed to operationalize the strategies outlined in the Food and Nutrition Security Policy. It provided guidance on coordinating nutrition interventions carried out by the government and other nutrition stakeholders (GoK 2012). Now expired, the plan is currently being revised.
-
The Nutrition Inter-Agency Coordinating Committee—a network of government ministries (Health, Education, Agriculture, Planning, and Labour), United Nations agencies, civil society, academic and research institutions, the private sector, and multilateral and bilateral donors—provides coordination on nutrition-specific activities (Samburu, Voleje, and Gitau 2015).
-
The Breast Milk Substitute Act of 2012, the Baby Friendly Hospital Initiative, and the Baby Friendly Community Initiative promote breastfeeding in Kenya (SUN 2012; APHRC 2014).
-
The Agricultural Sector Development Strategy (ASDS, 2010– 2020) states that the vision for the sector is “A Food Secure and Prosperous Nation.” Although nutrition is mentioned in the ASDS, it is not a primary focus (GoK 2010a).
-
Sessional Paper No. 8 of 2012 on the National Policy for the Sustainable Development of Northern Kenya and other Arid Lands (known as the ASAL Policy) established the policy framework for development in the arid and semi-arid lands (ASALs), which face high levels of poverty, food insecurity, and undernutrition (IIED 2013).
-
The 2016 Climate Change Act, the Kenya National Adaptation Plan 2015–2030, and the Ending Drought Emergencies initiative include strategies to adapt to climate change, support sustainable livelihoods in drought-prone areas, and build resilience (WFP 2018).
Policy Recommendations for Moving Forward
-
Prioritize policies and programs that increase the productivity, food security, nutrition, and resilience of small-scale farmers and pastoralists. Such steps will be increasingly vital for Kenya’s future given the large share of the population that is dependent on pastoralism and rain-fed agriculture and the vulnerability of these groups to climate change and drought.
-
Continue to promote education for women and girls, particularly in areas dominated by pastoralism, which are characterized by low female education rates and high child wasting rates. Women’s education and child nutrition have been shown to be positively linked.
-
Strengthen support for improvements in the water, sanitation, and hygiene (WASH) environment in Kenya, including implementation of the Kenya Environmental Sanitation and Hygiene Policy, 2016–2030. Urban settlements, rural areas, and informal settlements face the lowest levels of improved sanitation, compared with planned urban areas (GoK 2016). Inadequate WASH facilities and practices are detrimental to human health and nutrition.
-
Give strong political and educational support to the production, distribution, and consumption of nutritious crops such as vitamin A–rich orange-fleshed sweet potatoes and ensure that lower-income households have access to these products.
-
Ensure that food security and nutrition are given priority at the national and county levels, recognizing the vital role that county governments must play given Kenya’s devolved government structure. Food security and nutrition decisions should be guided by the data that exist at the county level (see KNBS et al. 2015).
-
The Food Security Bill, 2017, and the National Nutrition Action Plan, 2018–2022, are still under consideration but have not been finalized (GoK 2017; SUN 2017). These should be finalized and implemented to ensure that food and nutrition security is prioritized in Kenya.
-
The Breastfeeding Mothers Bill (2017), which aims to protect women’s right to breastfeed in the workplace and public places, has not been signed into law by the president. This bill should be enacted to further promote breastfeeding in Kenya, which is critical to child nutrition.
-
Increase investment to strengthen community capacity to prepare for future nutrition crises by providing staffing, training, and resources for community-based management of acute malnutrition (CMAM).
-
Support innovative programs such as the surge model, which establishes nutrition thresholds to trigger emergency nutrition support, and the integrated management of acute malnutrition (IMAM) model, which incorporates contributions from local, international, and faith-based partners to respond to nutrition crises (Concern Worldwide 2013; Wambani 2012; USAID 2017).
Footnotes
- The poverty rates expressed here are poverty headcount ratios at $1.90 per day (2011 purchasing power parity).
- Globally, undernutrition is responsible for nearly half of deaths among children younger than five years old (Black et al. 2013).
- Data from 2008–2012 are used to calculate 2010 GHI scores, and data from 2013–2017 are used to calculate 2018 GHI scores. See Appendix B in the 2018 GHI report for more details.
- Women’s education levels in West Pokot are poor—34 percent of women have received no education—but the situation is not as extreme as in the other counties mentioned here, where 62 to 77 percent of women have had no education (KNBS et al. 2015).
- A “minimum acceptable diet” is a standard that combines minimum dietary diversity and minimum meal frequency, with different recommendations for breastfed and non-breastfed children, who need to receive milk or milk products as a substitute for breast milk.
Authors
Jill Bernstein and Doris Wiesmann