Ethiopia:
A Closer Look at Hunger and Undernutrition
A Poor Country but Growing Fast
Although Ethiopia is a low-income country, recent rapid economic growth has done a great deal to reduce the share of Ethiopians living in poverty. In fact, with GDP growth averaging 10.3 percent a year between 2005/2006 and 2015/2016 (World Bank 2018c), Ethiopia has been one of the world’s fastest-growing economies in recent times (Gebru, Remans, and Brouwer 2018). From 1999 to 2015, its poverty rate fell from 55.5 percent to 26.7 percent (World Bank 2018b). Still, in 2017 GDP per capita was just $768 (World Bank 2018b).
The country’s recent economic growth has been driven largely by growth in agriculture, which plays a prominent role in Ethiopia’s economy and has been the focus of recent government investments and policies (FAO 2018b). About 85 percent of the population engages in smallholder farming, with agriculture accounting for 37 percent of GDP in 2016 (FAO 2018b; World Bank 2018b). The bulk of agricultural land is used to grow cereal crops including teff (a local grain), wheat, maize, sorghum, and barley (Taffesse, Dorosh, and Asrat 2012). The rapidly growing service sector is also playing an expanding role in the overall economy (World Bank 2015).
With the decline in poverty, income inequality has also fallen. Regional disparities in poverty rates have narrowed since 1996, when some regions had much higher poverty rates than others. Yet at a finer level of detail, disparities remain: marginalized groups and people with limited access to roads, markets, health services, and other institutions face the highest levels of poverty (World Bank 2015).
Hunger and Undernutrition Persist
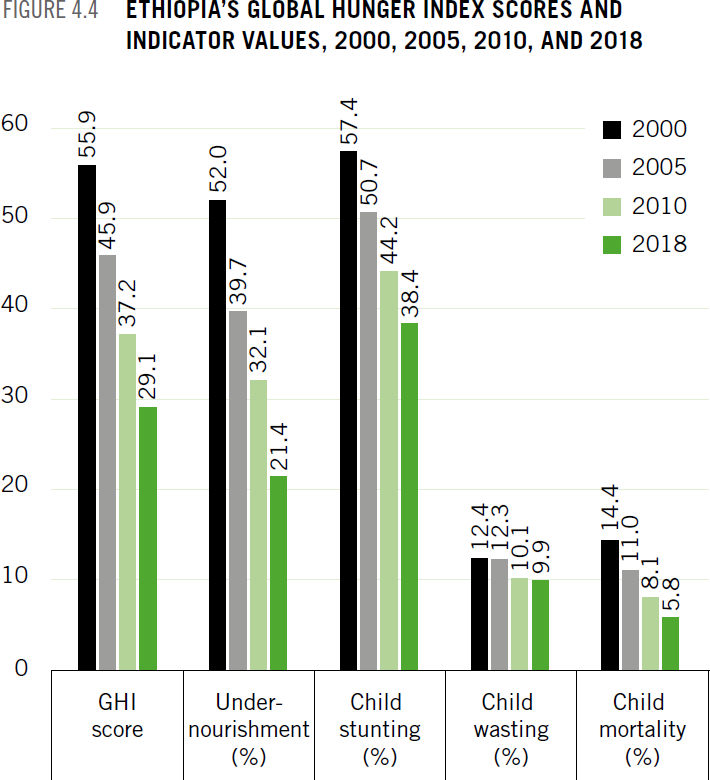
Like poverty, hunger and undernutrition among Ethiopians have decreased in recent decades but remain problematically high. Ethiopia’s 2000 Global Hunger Index (GHI) score was 55.9 - considered extremely alarming - whereas its 2018 GHI score is 29.1, which is at the upper end of the serious category (see About section for a guide to interpreting GHI scores). Each of the GHI indicators has also declined since 2000 (Figure 4.4). Yet serious threats remain.
An El Niño–induced drought worsened the food security situation in Ethiopia in 2016–2017 (FAO GIEWS 2017b). Furthermore, a flare-up of conflict in the Oromia and Somali regions in 2017 has led to the displacement of nearly 1 million people, threatening their agricultural activities, livelihoods, and food security (FEWS NET 2018a). Most Ethiopians consume a poor-quality diet that lacks a diverse range of foods; provides inadequate amounts of key nutrients including protein, vitamin A, and zinc as well as micronutrient-rich foods such as fruits and vegetables; and exposes consumers to food-borne pathogens (Gebru, Remans, and Brouwer 2018).
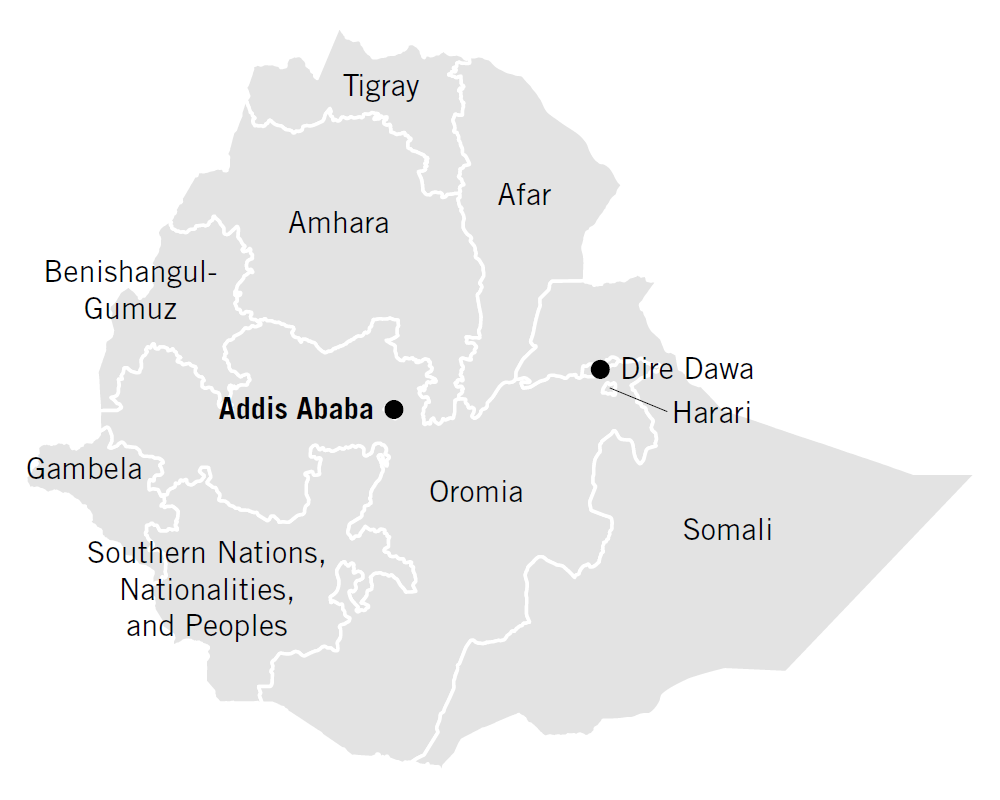
Of particular concern is the nutrition situation of children, given that poor nutrition during gestation and in the first two years of life has lifelong consequences. At 38.4 percent, Ethiopia’s child stunting level for children under five is considered “high” verging on “very high,” and at 9.9 percent its child wasting level for this age group is considered “poor” verging on “serious” according to World Health Organization guidelines (WHO 2010). These rates vary from region to region within Ethiopia, and in some cases the regional rates are substantially higher than the national averages (Table 4.2).
Poor feeding practices for infants and children seem to be a major factor behind these troubling numbers. Sixty-seven percent of children under the age of 24 months receive age-appropriate breastfeeding, but just 7.3 percent of children aged 6–23 months are fed the minimum acceptable diet. Even in Addis Ababa, which has the country’s largest share of children in this age group consuming the minimum acceptable diet, the rate is still low at just 27.1 percent (CSA and ICF 2016). Many other recent studies have documented the inadequacy of infant and young child feeding practices in various parts of Ethiopia, including Abiy Addi town, Tigray region (Mekbib et al. 2014), and Sidama Zone, Southern Nations, Nationalities, and Peoples’ Regional State (SNNP) (Tessema, Belachew, and Ersino 2013; Gibson et al. 2009). In many of these studies, the authors conclude that inadequate infant and young child feeding practices are a primary cause of child stunting. Even in an area with surplus food production (West Gojjam Zone, Amhara region), child stunting was found to be high in past research, and inappropriate feeding practices were the principal risk factor for nutritional deprivation among children under the age of five (Teshome et al. 2009).
The overall health of children also plays a role in their nutrition. Studies have shown that diarrheal disease is associated with child stunting, wasting, and underweight (Asfaw et al. 2015). In Haramaya woreda, Oromia region, diarrhea is associated with underweight, and fever is associated with wasting (Yisak, Gobena, and Mesfin 2015). The nutritional status of women is also important to consider, both for the sake of women themselves and for their children. Women with low levels of empowerment and decision-making power are about 50 percent more likely to experience undernutrition than other women (Tebekaw 2011). Approximately one-quarter of women of childbearing age in Ethiopia have a low body mass index (BMI), which puts their children’s nutritional status at risk (Negash et al. 2015; Tigga and Sen 2016). Early childbearing is common, with 27.7 percent of women giving birth before the age of 19, which places strain on the nutritional status of women and infants (USAID 2018a). In Debub Misraqawi Zone, Tigray region, breastfeeding women had inadequate dietary intake and poor anthropometric measures—factors that have negative implications for the nutrition of their children (Haileslassie, Mulugeta, and Girma 2013).
Livestock ownership—an important part of many Ethiopian households’ livelihoods—can contribute to children’s nutrition, but the link is not always straightforward. Cow ownership raises children’s milk consumption and height-for-age and reduces child stunting, particularly in areas where markets for milk are limited and home consumption is more important (data from Amhara, Oromiya, SNNP, and Tigray regions in Hoddinott, Headey, and Dereje 2015). Qualitative research in the pastoralist Sitti (formerly Shinile) and Liben Zones of Somali region revealed that animal milk plays a large role in the diets of young children, but that milk supply is vulnerable during the dry season and droughts (Sadler and Catley 2009). In Amhara, Oromia, Somali, SNNP, and Tigray regions, a household’s poultry ownership is positively associated with children’s height-for-age, but keeping poultry inside the home overnight is negatively associated with children’s height-for-age, suggesting a trade-off between improved diet and increased exposure to pathogens that can negatively affect nutritional status (Headey and Hirvonen 2016).
Finally, several studies show an association between market access, roads, and nutrition. All else being equal, children whose households are located closer to food markets in East Tigray Zone, Tigray region, have greater weight-for-age and weight-for-height, although proximity to markets is not sufficient to offset poor nutrition in the lean season (Abay and Hirvonen 2016). In Alefa woreda, Amhara region, remote communities have poorer diets than communities that are less remote (Stifel and Minten 2017). Mothers’ nutritional knowledge is positively associated with children’s dietary diversity in Alefa woreda, Amhara region, but only in areas with good access to markets (Hirvonen et al. 2017). Furthermore, children in households that produce a more diverse range of agricultural products tend to have more diverse diets, particularly in areas where there is poor market integration (Hirvonen and Hoddinott 2014).
What Has Worked in Addressing Hunger and Undernutrition
Table 4.2:
GHI INDICATOR VALUES FOR REGIONS AND CHARTERED CITIES, ETHIOPIA
| Region/city | Child stunting (%) | Child wasting (%) | Child mortality (%) |
|---|---|---|---|
| Tigray | 39.3 | 11.1 | 5.9 |
| Affar | 41.1 | 17.7 | 12.5 |
| Amhara | 46.3 | 9.8 | 8.5 |
| Oromiya | 36.5 | 10.6 | 7.9 |
| Somali | 27.4 | 22.7 | 9.4 |
| SNNP | 38.6 | 6.0 | 8.8 |
| Gambela | 23.5 | 14.1 | 8.8 |
| Harari | 32.0 | 10.7 | 7.2 |
| Benishangul-Gumuz | 42.7 | 11.5 | 9.8 |
| Addis Ababa | 14.6 | 3.5 | 3.9 |
| Dire Dawa | 40.2 | 9.7 | 9.3 |
| Total | 38.4 | 9.9 | 6.7 |
|
Source: CSA and ICF (2016). Note: All indicators are for children from age zero to five. Undernourishment values at the subnational level are not currently available for Ethiopia. The national child mortality estimates here and in Figure 4.4 differ because CSA and ICF (2016), which contains subnational values, is cited here while UN IGME (2017a), cited in Figure 4.4, is used for the calculation of GHI scores. |
|||
Ethiopia’s sustained economic growth has contributed to improvements in children’s nutrition, including child stunting, child wasting, and child underweight. These improvements may be due in part to associated increases in household expenditure on food and increased public spending on health, infrastructure, and other areas related to development (Biadgilign, Shumetie, and Yesigat 2016). As described below, much evidence is available on the impact of interventions that have been implemented in Ethiopia to address hunger and undernutrition.
Some of these projects have centered on livestock and other agricultural interventions. Government policies to promote agricultural productivity and food security in Tigray region, including the promotion of fertilizers and improved seeds, are associated with increased food availability and food self-sufficiency (van der Veen and Gebrehiwot 2011). In Holetta town, Oromia region, a project promoting ownership of crossbred cows that can be used for both traction and milk production was associated with higher household income and increased caloric intake (Ahmed, Jabbar, and Ehui 2000). In the Liben and Sitte (formerly Shinile) Zones of Somali region, a project offering livestock feed, vaccinations, and deworming to pastoralist communities during the dry season/drought resulted in increased milk production, raised children’s milk consumption, and stabilized their weight-for-age (Sadler et al. 2012).
Food aid programs also improved recipients’ diets and nutrition. In rural Ethiopia, the Employment Generation Schemes—a food-forwork program—and a free food distribution program known as Gratuitous Relief both raised household food consumption, even after the programs had ended (Gilligan and Hoddinott 2007). Quisumbing (2003) finds that food-for-work and free distribution of food boosted children’s weight-for-height in rural areas. Using nationally representative data, Yamano, Alderman, and Christiaensen (2005) find that food aid increased children’s height relative to that of children in control communities.
An assessment of an Alive & Thrive program, which promotes proper infant and young child feeding practices, in SNNP and Tigray regions showed a positive association between the program and improved breastfeeding and complementary feeding practices (Kim et al. 2016).
Safety net programs can make a difference as well. The Productive Safety Net Programme (PSNP)—a large-scale, government-led safety net program that has reduced poverty in Ethiopia by 2 percentage points (World Bank 2015)—provides food or monetary transfers to food-insecure people. Started in 2005, it has reached more than 1 million participants and their families (Berhane et al. 2014). With data from Tigray, Amhara, Oromiya, and SNNP regions, Berhane et al. (2011) show that the PSNP and associated programs improved food security by reducing the number of months without sufficient food. Using data from the same regions, Gilligan, Hoddinott, and Tafesse (2009) show that the PSNP in combination with the complementary Other Food Security Programme (OFSP) improved household food security. Using data from Tigray region, Debela, Shively, and Holden (2015) find that the PSNP improved weight-for-height in children. In Abiy Addi and Hintalo Wajirat woredas, Tigray region, the Social Cash Transfer Pilot Programme, which was targeted to poor and laborconstrained households, also improved diet quantity and quality (Berhane et al. 2015).
Researchers have evaluated more multifaceted projects as well. The Ibnat-Belessa integrated food security program, which includes environmental rehabilitation, water supply, irrigation, livestock, crop production, fruit and vegetable production, feeder road construction and maintenance, and off-farm activities, increased the calories consumed in beneficiary households in Amhara region (Abebaw, Fentie, and Kassa 2010). A study of the Graduation Programme, which combines temporary consumption support with an asset transfer and other activities, showed that beneficiaries experienced higher per capita food consumption and greater improvements in self-reported food security indicators, such as whether everyone in the household receives enough food relative to controls (Banerjee et al. 2015).
Water, sanitation, and hygiene interventions can potentially improve nutrition by reducing the incidence of infection and disease, which limit the body’s ability to absorb nutrients. A study from South Wollo Zone, Amhara region, compared groups that received water, sanitation, and hygiene interventions; nutrition education; health support; a combination of all interventions; and a control group. Only the water, sanitation, and hygiene group showed a significant reduction in child stunting, possibly through improved hygiene (Fenn et al. 2012). Nutrition; health; and water, sanitation and hygiene interventions have paid off in terms of child survival as well. Nutrition interventions resulting in decreased rates of wasting and stunting; water, sanitation, and hygiene interventions; treatment of diarrhea with oral rehydration solution; and the introduction of the Hib vaccine were determined to be the main factors behind the decline in child mortality between 2000 and 2011 (Doherty et al. 2016).
Existing Policies That Affect Food Security and Nutrition
In recent years, the Government of Ethiopia has implemented a variety of policies and programs that reflect a strong commitment to addressing food insecurity and malnutrition:
-
The Growth and Transformation Plan (GTP) guides public spending. Agriculture, food security, education, health, roads, and water constitute 70 percent of total general government expenditure (World Bank 2015).
-
The Agricultural Growth Program (AGP-I), 2010/2011 to 2015/2016, emphasized agricultural intensification, growth, and the transformation from subsistence to commercial agriculture. The follow-up, AGP-II, 2016/2017 to 2020/2021, also includes an emphasis on nutrition (Gebru, Remans, and Brouwer 2018).
-
The Agricultural Sector Policy and Investment Framework (PIF), 2010 to 2020, serves as a framework for prioritizing and planning investment in agriculture. One of its goals is to “sustainably increase rural incomes and national food security” (FAO 2014).
-
The National Nutrition Strategy (NNS), originally put in place in 2008, is intended to coordinate action on nutrition by the relevant governmental and nongovernmental actors (Beyero, Hodge, and Lewis 2015).
-
The National Nutrition Programme (NNP), first launched in 2009 and managed by the Ministry of Health (MoH), is the framework for implementing the NNS. The NNPII was revised for 2013– 2015 and extended to 2016–2020. NNPII emphasizes the multi-sectoral approach that is needed to address nutrition (SUN 2015).
-
The Seqota Declaration (2015) is a commitment by the Government of Ethiopia to end malnutrition by 2030 (Gebru, Remans, and Brouwer 2018; SUN 2015).
-
Additional programs include the Food Security Programme (FSP) and the Productive Safety Net Programme (PSNP), which is a part of FSP (Beyero, Hodge, and Lewis 2015). Phase 4 of the PSNP includes increased emphasis on gender equity, in part to increase the impact on nutrition (GOE MOA 2014).
Recommendations for Making More Progress in Tackling Hunger and Undernutrition
Based on existing knowledge of the nature of food and nutrition insecurity in Ethiopia, as well as the evidence regarding the policies and programs that have successfully addressed these challenges, the following actions by the government, nongovernmental organizations, and the international community would be efficient and effective and have a high impact:
-
Encourage collaboration between the nutrition, health, and agriculture sectors at all levels, from the national ministries to the regions, zones, woredas, and kebeles. Support multisectoral interventions and/or co-location of interventions that simultaneously address food security and nutrition; health; and water, sanitation, and hygiene challenges, with an emphasis on the needs of women and children.
-
Continue to support agricultural development, with a specific focus on small-scale farmers. Adopt a stronger emphasis on nutrition within the Agricultural Sector Policy and Investment Framework (PIF).
-
Invest in infrastructure, particularly road networks and market access, with a focus on benefiting marginalized communities in terms of poverty, nutrition, and health.
-
Support nutrition education and behavior change communication, especially to improve caregivers’ knowledge of appropriate infant and young child feeding practices, including timely introduction of complementary foods, minimum meal frequency, and dietary diversity.
-
Invest in water, sanitation, and hygiene interventions, as well as in research on the extent to which these interventions can address child stunting.
-
Continue to support and expand access to the PSNP with emphasis on the impacts on gender equity and nutrition.
Footnotes
- The poverty rates expressed here are poverty headcount ratios at $1.90 per day (2011 purchasing power parity).
- GDP per capita is expressed in current US dollars.
- The minimum acceptable diet is a core indicator of children’s diets that includes standards for minimum dietary diversity and minimum meal frequency, with different recommendations for breastfed and non-breastfed children.
- Regions are Ethiopia’s largest administrative divisions. These are broken into zones, which are further divided into woredas (districts) and then kebeles (wards).
- The authors found that PSNP alone, without OFSP, had little impact on beneficiaries on average, in part because actual transfer levels were far below the program targets. This study evaluated the program using data from 2005/2006 in the early years of its implementation.
Bibliography
CSA (Central Statistical Agency) [Ethiopia] and ICF. 2016.
Ethiopia Demographic and Health Survey 2016. Addis Ababa, Ethiopia, and Rockville, MD, USA.
FAO (Food and Agriculture Organization of the United Nations). 2018b.
“Ethiopia at a Glance.” Accessed July 20, 2018.
FAO GIEWS (FAO Global Information and Early Warning System). 2017b.
“Region: East Africa: Prolonged and Severe Drought Exacerbates Food Insecurity: Special Alert.” Accessed July 20, 2018.
Gebru, M., R. Remans, and I. Brouwer. 2018.
Food Systems for Healthier Diets in Ethiopia: Toward a Research Agenda. Washington, DC: International Food Policy Research Institute.
Mekbib, E., A. Shumey, S. Ferede, and F. Haile. 2014.
“Magnitude and Factors Associated with Appropriate Complementary Feeding among Mothers Having Children 6–23 Months-of- Age in Northern Ethiopia: A Community-Based Cross-Sectional Study.” Journal of Food and Nutrition Science 2 (2): 36.
Taffesse, A. S., P. Dorosh, and S. Asrat. 2012.
“Crop Production in Ethiopia: Regional Patterns and Trends.” Washington, DC, and Addis Ababa: International Food Policy Research Institute and Ethiopian Development Research Institute.
World Bank. 2015.
Ethiopia Poverty Assessment 2014. Washington, DC.
World Bank. 2018b.
Data: Indicators. Accessed July 20, 2018.
World Bank. 2018c.
“The World Bank in Ethiopia.” Accessed July 20, 2018.
WHO (World Health Organization). 2010.
Nutrition Landscape Information System (NLIS) Country Profile Indicators: Interpretation Guide. Geneva.
Disclaimer
The boundaries and names shown and the designations used on the maps herein do not imply official endorsement or acceptance by Deutsche Welthungerhilfe or Concern Worldwide.
Authors
Welthungerhilfe: Fraser Patterson (Policy Advisor, Food and Nutrition Security), Andrea Sonntag (Policy Advisor, Nutrition and Right to Food), Lisa Maria Klaus (Policy and External Relations), Jan Fahlbusch (Director, Policy and External Relations); Concern Worldwide: Olive Towey (Head of Advocacy, Ireland & EU), Connell Foley (Director of Strategy, Advocacy, and Learning); Independent Consultants: Klaus von Grebmer, Jill Bernstein, Heidi Fritschel.