Sustainable Food Security under Land, Water, and Energy Stresses
“The tight interconnections between water, energy and land make clear that the management of each of them cannot be considered in isolation, but must be seen as part of an integrated system.”
European Report on Development, 2012
Note: The views expressed in this chapter are those of the author. They do not necessarily reflect the views of IFPRI, Welthungerhilfe, or Concern Worldwide.
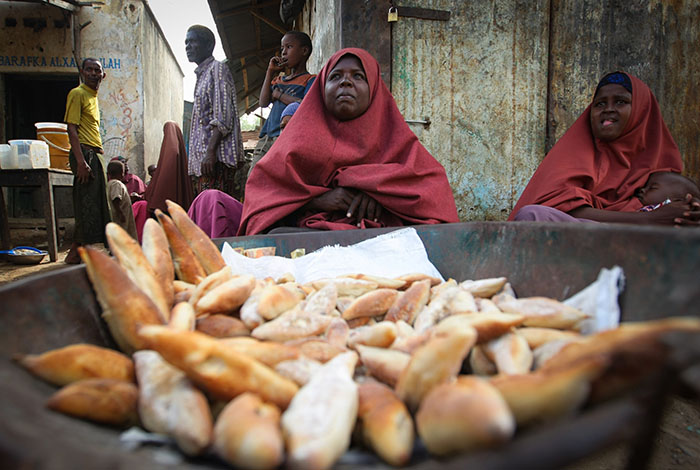 A Somali woman sells bread at the market in Jawahar, Middle Shabelle region, Somalia. Higher food prices are one signal of the need for a new model. UN Photo/Stuart Price.
In the pursuit of agricultural and economic growth, natural resource scarcity and degradation have generally been afterthoughts. The rate of consumption growth, even more than population growth, has proven difficult to slow, testing our ability to meet the basic needs of the most vulnerable people (Ehrlich, Kareiva, and Daily 2012) by putting pressure on resources and pricing poor people out of access to these resources.
Recent developments in the land, water, and energy sectors have been wake-up calls. The stark reality is that we need to produce more with less while eliminating wasteful practices and policies. In other words, we need a new socioeconomic model that is sustainable and that prioritizes poor and marginalized people.
Higher food prices are one signal of the need for a new model. Prices rose by nearly 40 percent in 2007 and further increased in 2008, pushing 130–155 million people into extreme poverty. During this same period the number of children suffering permanent cognitive and physical injury due to malnutrition may have increased by 44 million (World Bank 2009). Food prices flared up again in 2011 as well as in 2012 and are unlikely to decline in the foreseeable future to the levels achieved in the early to mid-1990s. In addition to food price increases, food price volatility increasingly affects poor consumers and producers across the globe (von Grebmer et al. 2011).
The way we use land, water, and energy plays a significant role in the changing global food economy. Partly in response to the food price hikes, the number of international and national agricultural land deals has soared over the past 5–10 years (Anseeuw et al. 2012a, b). Many of the land leases and other agreements have targeted Sub-Saharan Africa, where land rents are cheaper and regulatory systems are weaker. Moreover, land deals are found more often in those countries with high GHI values. While demand for land is rising, continued land degradation is posing challenges. Soaring oil prices have also contributed to both higher food prices and the drive for land investments in developing countries, particularly for the production of first-generation biofuels (Anseeuw et al. 2012b).
Rapid growth in domestic and industrial water demand - as a result of population and economic growth, increased urbanization, and associated, changing lifestyles - as well as changing climate, increased variability in rainfall patterns, and rapidly growing water pollution levels, have increased water scarcity across much of the developing world, especially in emerging countries (Rosegrant, Ringler, and Zhu 2009). Water pollution and poor access to sanitation, especially in Sub-Saharan Africa and South Asia, contribute to the contamination of food and drinking water and lead to diarrheal disease, a major source of childhood illness and death in the developing world.
The need for increased investment to achieve water security has, for example, been recognized by China, which plans to invest an unprecedented US$630 billion in water conservation over the next 10 years (Huang 2012).
As a result of economic and population growth, wealthier populations in the developed and increasingly the developing world are juxtaposed with nearly 1 billion food-insecure people and 2 billion people suffering from micronutrient deficiencies. High levels of hunger are generally found in those countries and regions where access and property rights to water and land are limited or contested and where modern energy sources and access to sanitation are underdeveloped (see Figure 3.1).
Energy use is particularly low in Sub-Saharan Africa and South Asia, where people still make heavy use of traditional biomass, such as fuelwood, cow dung, and crop residues.
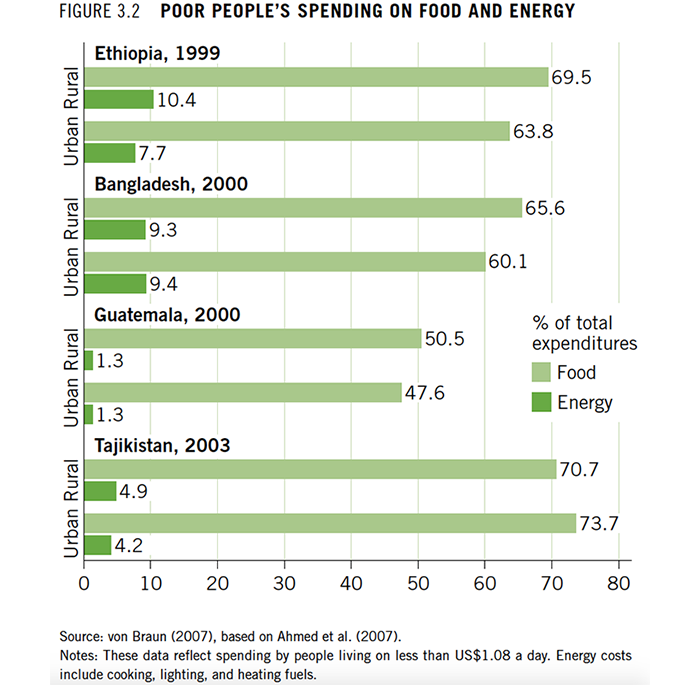
In Sub-Saharan Africa, almost 70 percent of people rely on wood (and its by-products) as their primary cooking fuel (Legros et al. 2009). Although the poorest people spend relatively little on energy (Figure 3.2), in part because of poor access, their use of traditional energy has other costs in terms of their time, health, and environment.
Collection of fuelwood, for example, constitutes a major time burden for women and children, particularly in Sub-Saharan Africa. Indoor air pollution from the burning of biomass contributes to the death of nearly 2 million people annually, particularly women and children (Martin et al. 2011; von Braun 2007). Overall, according to the Foresight report, demand for energy is projected to increase by 45 percent between 2006 and 2030 and could double between now and 2050 (Foresight 2011).
As a result of increasing natural resource scarcity, sustainable food security is now inextricably linked to developments in the water, energy, and land sectors (Figure 3.3). Pressures on these sectors for non-food uses, from biofuel mandates and urban and industrial development, as well as uncoordinated, injudicious use of these natural resources, will directly affect the food security of the poor and most vulnerable.
Contributors to Natural Resource Scarcity
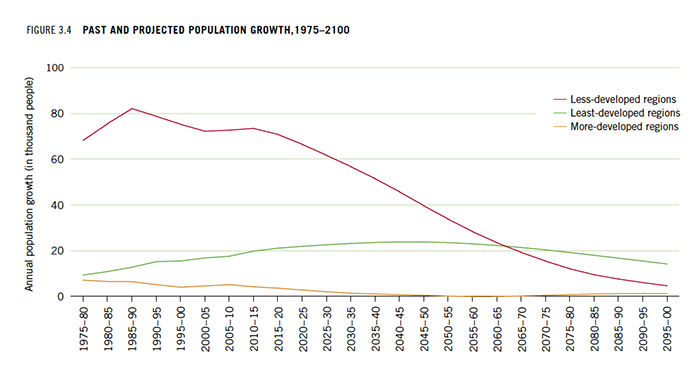 Note: More-developed regions comprise Europe, North America, Australia/New Zealand, and Japan. Less-developed regions comprise all regions of Africa, Asia (excluding Japan), and Latin America and the Caribbean, plus Melanesia, Micronesia, and Polynesia. The least-developed countries include 33 countries in Africa, 9 in Asia, 5 in Oceania, and 1 in Latin America and the Caribbean. Source: Authors, based on UN (2011).
Demographic Changes.
According to the United Nations medium variant scenario, the world’s population is expected to reach more than 8 billion by 2025 and more than 9 billion by 2050 (UN 2011). This increase occurs in the midst of major demographic changes. Fertility has declined rapidly in recent decades in most low- and middle-income countries.
Total fertility rates are converging toward replacement level - that is, the rate at which population growth through reproduction will be approximately zero — except in 35 countries, mainly in Sub-Saharan Africa (World Bank 2007). In countries where fertility has declined significantly and mortality rates have fallen, population growth has slowed and the population has become older. However, countries where the population is still growing rapidly, mainly in Sub-Saharan Africa and parts of Asia, will face significant challenges because of expanding demand for public services, goods (such as food and clothing), and investments in education and health. Countries will need to increase such investments as the population increases, making it difficult for them to invest in other key sectors such as agriculture (World Bank 2007).
Almost all of the additional population will live in the group of “less-developed” countries (Figure 3.4). Strong income growth in many of these countries will drive the shift in diets toward more protein-rich and more resource-demanding commodities (such as meat and milk). Those countries with growing populations and limited ability to increase domestic production in line with growing demand, particularly in the Middle East and Africa, will experience an increase in demand for imported staples and high-value agricultural commodities.
In addition to population growth, migration from rural to urban areas in developing countries will have significant effects on food consumption patterns. About 52 percent of the world’s population currently lives in urban areas; by 2050, 67 percent will live in cities (UN 2011). When people move to urban areas, they tend to eat fewer basic staples and more fruits, livestock products, and cereals requiring less preparation. It will be a challenge to meet this demand in a sustainable manner (Tokgoz and Rosegrant 2011).
Higher Incomes and Unsustainable Resource Consumption.
Rapid economic growth in some developing countries over the past several decades is supporting the emergence of a relatively wealthy, generally urban middle class, estimated at 2 billion people (Court and Narasimhan 2010). While economic progress is laudable, its impacts on natural resource use are substantial. Wealthier, more urbanized populations have transitioned toward more diversified diets, increasing their consumption of not only meat, but also vegetables and sugars — all of which require much more water and energy per unit of calorie produced. The lifestyles in industrialized countries are particularly characterized by overuse of both renewable and fossil resources.
Moreover, the benefits of economic growth have not reached everyone: even though global poverty levels have declined overall, the number of people living on between $1.25 and $2 a day nearly doubled between 1981 and 2008: from 648 million to 1.18 billion. The rate of growth in the number of people earning more than $2 a day has slowed (Chen and Ravallion 2012). In some countries and regions, these poor are trapped in downward spirals of abject poverty, low prospects for economic activity, and unavailable or degraded natural resources.
Poor Policies and Weak Institutions.
Demographic change and economic growth are the fundamental drivers of natural resource scarcity, but the future of land, water, and energy security will be decided by agricultural, climate, energy, science, and trade policies and institutions (Ringler, Biswas, and Cline 2010). One policy area — biofuels — is briefly discussed to highlight the much broader issues behind this topic.
A number of factors have driven interest in biofuels as a renewable energy source. These include higher energy prices stemming from increased demand for energy, concerns about climate change, the desire to reduce dependence on imported energy sources, and the potential for rural growth and employment generation (Ewing et al. 2010; Kammen 2006). Biofuel policies have, however, resulted in increased pressure on land and water. Given that biofuels are not yet economically viable, biofuel policies typically include significant tax breaks for biofuel refineries combined with subsidies for feedstock and consumption targets or mandates for biofuels in the transportation sector. These mandates have resulted in large-scale investment in biofuels and expansion of crop area to produce biofuel crops. If these biofuel mandates were met through domestically grown feedstocks alone, they would require 30 percent of US agricultural area to be dedicated to produce fuel for transportation; in Europe, the share would be 72 percent (Ewing et al. 2010). The increased biofuel demand during 2000–2007, compared with previous rates of growth, is estimated to have accounted for 30 percent of the increase in weighted average grain prices during this period, resulting in a significant increase in the number of malnourished children (Rosegrant 2008; Rosegrant et al. 2008a).
Moreover, the actual net carbon savings of first-generation biofuels have been questioned, particularly when production-induced land use changes are considered (Searchinger et al. 2008), and impacts on both water quantity and quality, which can be significant, are growing (Moraes, Ringler, and Cai 2011).
Evidence of Natural Resource Scarcity
Energy.
Global energy prices have increased significantly in recent years and are projected to continue to rise, albeit more slowly. If current policies continue, the International Energy Agency projects an increase in real crude oil prices from US$78 a barrel in 2010 to US$140 by 2035. This represents a 2.4 percent annual increase. If aggressive investments in alternative energy fuels were to be made, oil price increases would be somewhat lower (IEA 2011).
Rising energy prices affect agriculture in several ways. Higher energy prices make biofuels more profitable, increasing the demand for agricultural land to be converted to the production of biofuel crops. At the same time, rising energy prices raise farmers’ costs, especially given that the agriculture sector has become more energy intensive. For example, farmers use diesel fuel and gasoline for tillage, planting, transportation, and harvesting. They use electricity, liquefied petroleum, gasoline, and natural gas to irrigate fields; operate livestock, poultry, and dairy facilities; and process and store perishable commodities (USDA 2006). Another important energy cost component is fertilizer use. According to Pimentel (2006), conventional agricultural production in the United States uses approximately 1,000 liters of fossil energy per hectare, divided approximately equally among petroleum-based fertilizers, mechanization, and other activities and inputs, such as pesticides. More broadly, the price of energy influences the prices of inputs, water, and transportation and marketing, all affecting agricultural production and food prices.
The share of energy in farmers’ costs varies significantly within and between countries. Among the crops grown in the United States, the share of energy in total operating costs ranged from about 55 percent for wheat to about 20 percent for cotton in 2004 (USDA 2006). Energy accounts for a smaller share of farmers’ costs in developing countries, but that share is rising as agricultural activities in those countries increase their use of technology and become more mechanized. In Vietnam, for example, energy accounted for 18 percent of total operating costs for maize in 2000 (IFPRI 2001). Newer estimates will likely show larger energy contributions to total production cost.
Because of rising energy costs, agriculture-intensive producers will see their cost of producing, transporting, and processing agricultural commodities rise. Higher energy prices will induce farmers to shift to less energy-intensive crops. At the same time, energy-saving agricultural practices such as conservation tillage, low-water-pressure and low-water-use irrigation, and improved fertilizer management will become more profitable.
Energy prices will also affect how water resources are used. It will become more expensive to extract and convey irrigation water—particularly using pump irrigation—and to desalinize seawater for drinking and household use. The higher cost of obtaining water will create incentives to develop more efficient mechanisms for allocating water and to reduce water losses, leaks, and runoff. Government subsidies for water and energy services and fertilizers will become increasingly expensive and may become fiscally unsustainable for many developing countries. This situation could provide incentives for reforming water policies and reducing subsidies. To date, however, there is little evidence of such reform. Higher energy prices also drive higher demand for hydroelectric power—often with positive impacts for domestic, industrial, and irrigation uses, but also with adverse social and ecological effects, such as resettlements and loss of fish and other freshwater ecosystem services.

Tomnissoi Davlat,
District Baljuvon, Tajikistan
This year, I only harvested 500 kilograms of wheat per hectare. I sowed my seeds too late because fuel prices rose sharply at the beginning of spring.... Once I had enough money for fuel and plowing services, it was too late.
Robert Mugabe,
Kabarole District, Uganda
I have no income. I only have a couple of acres to cultivate maize, cabbage, beans, tomatoes, and onions. At the same time I have to care for my mother and sister. So the increasing prices made it very stressful for me to buy paraffin and firewood. But I’m working hard and selling some of my products... The most important thing is that we have enough to eat. So we are saving on energy. Instead of using four paraffin lamps to light the house, we now use only one.
Fulmani Mandi,
Jharkhand, India
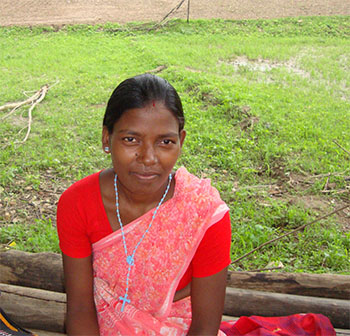
I am very worried about my children’s future. Now we have 2.5 acres of land. I have three sons. When they divide the land, each one of them will get only 0.8 acre, which is of no use. I don’t know how they will survive.
LAND.
Globally, agriculture occurs within a context of land scarcity, both because the world’s best arable land is already under cultivation and because agricultural practices have led to the degradation of significant amounts of farmland. At the same time, the rising demand for non-food products (feed, fuel, and fibre) is putting additional pressure on agricultural production and on land use.
Cultivated systems cover 25 percent of the globe’s terrestrial surface. A 10–20 percent increase in current crop area and pasture-land may be needed to meet growing food demand. This increase would come mainly from grassland and forestland (Millennium Ecosystem Assessment 2005a, b). Demand for non-food agricultural products could push the need for land significantly higher. Such an expansion will have both direct and indirect impacts on other ecosystems and particularly on biodiversity. Intensification — that is, practices that allow for greater output from a given amount of land — will be key to minimizing the conversion of natural land to cropland and thereby preserving terrestrial biodiversity. At the same time, if poorly managed, intensification can increase runoff of fertilizers and pesticides into water bodies, adversely affecting public health and inland and coastal aquatic ecosystems.
Unsustainable agricultural practices have already resulted in land degradation, including desertification, deforestation, salinization, and soil erosion. The causes underlying these forms of land degradation include high population density, poverty, lack of land tenure, and lack of access to extension services and other forms of knowledge, infrastructure, and markets (Nkonya et al. 2011). Distortionary trade policies, output price policies, and input subsidies, particularly for water and fertilizer, have also contributed to degradation.
One way of assessing land degradation is to measure the loss of net primary production—essentially, the decline in vegetative vigor. Figure 3.5 shows the loss of net primary production from 1981 to 2003. Substantial degradation has occurred in most parts of the world. Past efforts to combat land degradation have often focused on drylands, where degradation causes desertification. However, the highest rate of degradation took place in humid and sub-humid areas (marked by rectangles in Figure 3.5), which accounted for 78 percent of land degradation over this period (Nkonya et al. 2011). The immediate causes of land degradation include biophysical causes, including topography, which determines soil erosion hazard, and climatic conditions, such as rainfall, wind, and temperature. Unsustainable land management, such as deforestation, forest degradation, soil nutrient mining, and cultivation on steep slopes, also contributes directly to land degradation.
For agricultural producers, farm-level land degradation can lower crop yields and raise production costs because farmers need to apply more fertilizers and other inputs to offset yield losses. Degradation can also have off-site costs in the form of excessive runoff of fertilizers and pesticides, siltation of dams and irrigation systems, eutrophication of lakes and oceans, and damage to mangrove swamps that support rich fisheries and provide many ecosystems services such as water filtration and prevention of erosion (Rosegrant, Nkonya, and Valmonte-Santos 2009).
Forests have important rainfall-regulating functions. Tropical forests can soak up storm water and then release it slowly, reducing flood and drought cycles. Water-regulating functions are particularly important in upper watersheds, where forests also help reduce soil erosion and thus prevent river sedimentation. Despite these and other important ecosystem functions, deforestation has also been significant in much of the world, as shown in Figure 3.6. The most serious deforestation has taken place in Africa and Central and South America. Some good news is also evident: reforestation is occurring in East, South, and West Asia and in the Caribbean. China has led the way in East Asia, with aggressive policies supporting reforestation. However, deforestation has accelerated in Southeast Asia.
One outcome of the scarcity and degradation of farmland is the growing number of deals giving land-scarce or resource-demanding countries access to farmland in land-abundant countries. Of the approximately 1,000 international land deals (many of which are implemented with national partners) recorded as of May 2012, 46 percent targeted land in Sub-Saharan Africa and 37 percent land in Asia (International Land Coalition 2012). Among the 665 international land investments that report a specific crop, 55 percent relate to biofuel production, 19 percent to forestry products for wood and fibre and flowers, and the remainder to food production. Altogether, as of May 2012, the recorded deals affected 57 million hectares of agricultural land, or 1.2 percent of global agricultural area (International Land Coalition 2012). It is important to note that foreign investment in land also has important implications for local water availability and use (Anseeuw et al. 2012a).
Figure 3.7 presents the size of land deals as a share of agricultural area for 52 target countries, relative to the importance of agriculture in each country and its GHI score. Four countries where agriculture accounts for a small share of gross domestic product (GDP) (less than 5 percent) and where hunger is low or moderate (a GHI score of less than 10) received land investments affecting about 1.2 million hectares. In contrast, 32 countries where agriculture accounts for a higher share of GDP (more than 5 percent) and hunger is serious or alarming (a GHI score of more than 10) received investments affecting about 41 million hectares, accounting for the bulk of the total investment — 73 percent.
Thus, the majority of international land deals to date have occurred in those countries that experience higher levels of hunger and where the population and national incomes depend heavily on agriculture. In 17 of those, international land deals account for more than 5 percent of current agricultural area, and in 7 countries, land deals account for more than 10 percent of total agricultural area: Cambodia, Ethiopia, Indonesia, Lao PDR, Liberia, the Philippines, and Sierra Leone. Out of the 245 land deals in these seven countries where the commodity grown is known, 75 deals or 31 percent are for trees, including acacia, eucalyptus, rubber, and flowers; 112 deals or 46 percent of all investments with known crops relate to biofuels; and the remainder are for other agricultural commodities.
Research to date reveals high social and environmental risks of such investments, while the promised benefits often fail to materialize (see also case studies in Chapter 4). Both anecdotal and emerging case study evidence has shown that local and national land rights systems in most of these countries remain weak; as a result, local communities that once used some of the land acquired by foreign governments and companies have lost their traditional or customary rights.
One country, Republic of Congo, has a high GHI score, a low share of agricultural GDP (less than 5 percent) and limited international land investment (approximately 100,000 hectares); 13 countries have a low GHI score partnered with agricultural GDP greater than 5 percent, accounting for 25 percent of total land investment areas. This group includes such agricultural heavyweights as Argentina, Brazil, and China, as well as Malaysia, which accounts for the largest number of land deals as a share of national agricultural area. Other countries in this group with investments greater than 500,000 hectares include Ghana, Peru, and Ukraine.
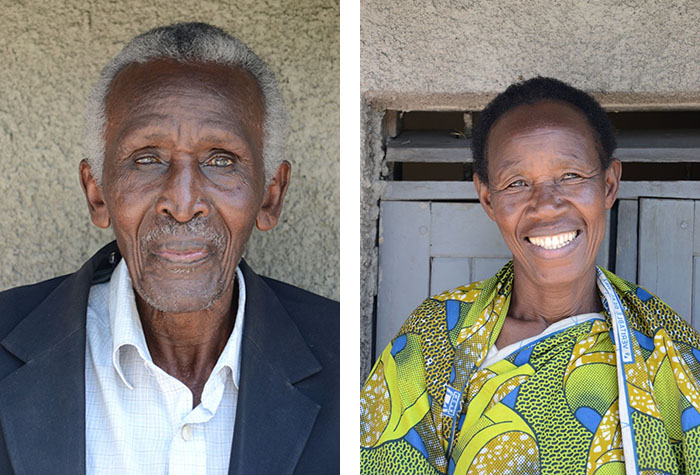
Kaseija Jailesi and Irene Kaseija,
Kabarole District, Uganda
Already now it is difficult to reach the wells, as you have to cross people’s land to reach them. That is prohibited though, and many landowners even fence in their land. With the worsening of the land situation, the water situation will become more difficult.
Water.
Currently, 36 percent of the global population — approximately 2.4 billion people—live in water-scarce regions, and 22 percent of the world's GDP (US$9.4 trillion at 2000 prices) is produced in water-scarce areas. Moreover, 39 percent of global grain production is unsustainable in terms of water use (Ringler et al. 2011), and 1.4 billion people live in areas with sinking groundwater levels (FAO 2009).
Water resources are distributed unequally across the globe, generally not in proportion to respective populations or land areas. For example, in 2005 per capita water availability in the most populous countries — China and India — was fairly low, at 1,691 and 1,101 cubic meters, respectively. In contrast, per capita water availability in Brazil (ranked fifth in terms of population) was 32,525 cubic meters and in Russia (ranked seventh in terms of population), 28,259 cubic meters. As a result of demographic changes in China and India, water availability is expected to further decline to 1,507 and 856 cubic meters per capita respectively by 2030, but subnational variations will be much larger.
Falkenmark, Lundqvist and Widstrand (1989) suggest that per capita annual water availability of less than 1,000 cubic meters limits economic development and human health and well-being, and availability of less than 500 cubic meters, experienced in much of the Middle East and North Africa, constitutes a major constraint to life.
Agriculture consumes 80 percent of the world’s “blue water” from rivers and aquifers, and is therefore both vulnerable to water scarcity and a contributor to it (Rosegrant, Cai, and Cline 2002). Water scarcity is exacerbated by climate change, especially in the driest areas of the world, which are home to more than 2 billion people and to half of all poor people. Moreover, increased flooding as a result of climate change and environmental degradation threatens agriculture in many parts of the world.
Besides population growth, other factors affect current and future global water use. Economic growth, for example, increases demand for water by households, industries, and farmers. Urbanization is associated with more water-intensive diets (meats, milk, vegetables, and sugars). Higher energy prices raise the cost of pumping water for irrigation and increase demand for hydropower. Climate change is raising temperatures and changing precipitation patterns, directly increasing demand and reducing availability of water for both rainfed and irrigated agriculture across the world.
Potential for growth in water supplies is limited, but domestic and industrial demand for water is growing rapidly. As a result, water is being transferred from agriculture to domestic and industrial uses (Rosegrant, Cai, and Cline 2002). This transfer will make irrigation water scarcer in rapidly growing, less-developed countries, and particularly in China and some countries in the Middle East and North Africa. By 2050 only 66 percent of irrigation water demands can likely be met, down from 78 percent in 2000. The decline will be much steeper in water-scarce basins (Rosegrant, Ringler, and Zhu 2009). Thus, current levels of water productivity, under a scenario of medium economic growth, will not be sufficient to ensure sustainability and reduce risks to people, food systems, and economies. By 2050, it is projected that under ”business as usual” 52 percent of the global population (4.8 billion people), 49 percent of global grain production, and 45 percent of total GDP (US$63 trillion at 2000 prices) will be at risk due to water stress. This water stress will likely affect key investment decisions; increase operational costs in the water, energy, and food sectors; and affect the competitiveness of water-scarce regions (Ringler et al. 2011).
Climate Change.
Agriculture, particularly rainfed systems in Africa and irrigated systems in Asia, is extremely vulnerable to the adverse impacts of climate change (ADB/IFPRI 2009; Nelson et al. 2009a; Nelson et al. 2010). FAO estimates that by 2085, climate change could result in the loss of 11 percent of arable land in developing countries. For Africa, the estimate is far higher (FAO 2012).
Higher temperatures reduce crop yields in much of the world while encouraging the proliferation of weeds, plant diseases, and pests. Changes in precipitation patterns shift growing seasons and increase the likelihood of crop failure in the short run and production declines in the long run. Although climate change could lead to gains in yields and cultivated area for some crops and in some regions, the overall impacts on agricultural production are projected to be highly negative, with increasing food prices intensifying the risk of hunger.
According to Parry et al. (2009), the number of people at risk of hunger is projected to increase by 10–20 percent by 2050 because of climate change. IFPRI IMPACT projections show increases in the number of malnourished children of up to 21 percent by 2050 as a result of climate change (Nelson et al. 2009a). Because the impact of climate change on child malnutrition is projected to be greatest in Sub-Saharan Africa, efforts to improve the various dimensions of the GHI need to be particularly strengthened there.
At the same time, agriculture contributes 9 percent to global greenhouse gas emissions. If land use change and deforestation, which are linked directly to agriculture, are added, the total contribution increases to 17 percent of global emissions (WRI 2010). Three-quarters of all agricultural emissions stem from developing countries. Thus, the task at hand will be to identify those interventions that reduce the adverse impacts of climate change on agriculture and at the same time reduce agriculture’s carbon footprint.
Alternative Pathways under Growing Natural Resource Scarcity
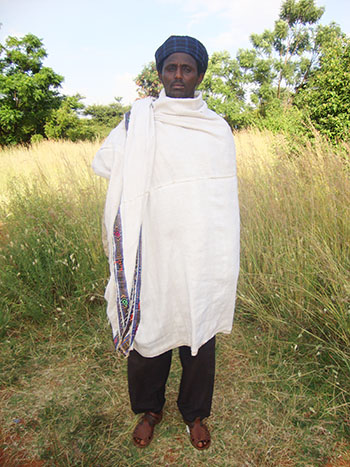
Ato Liben Boru Liben,
Oromia Regional State, Ethiopia
Pastoralists are migrating to urban areas because of high competition for water and pasture. However, only a few are successful in securing a job or engaging in income-generating activities, like opening small shops.

Lespérence Fedner,
Technical Coordinator, Welthungerhilfe, Jean Rabel, Haiti
My expenses in terms of energy and water have increased sharply in recent years. Moreover, because of the problems of environmental degradation, water is increasingly scarce, and rare from the taps at home. I have to build a private tank to store water for household needs in periods of little water.

Florence Akiiki Bamuturaki,
Kabarole District, Uganda
In the future, I am confident that there will be enough water and energy for our people as the country is developing.... I’m afraid the access to land is going to be a big problem in the nearer future. There will not be enough land for everyone. Our population is growing too fast, whereas land is a static resource which doesn’t grow according to the population living on it.
Over the next four decades, agricultural production will need to increase substantially to meet the demands of a growing and increasingly wealthy population. With current levels of investment and economic development, however, projected production increases can be achieved only at much higher prices. An alternative vision or model for development would seek not only to increase future production, but also to achieve better outcomes for the poor and pay more attention to sustainability, reducing adverse environmental impacts. Future demand could be lowered somewhat by more resource-conserving lifestyle choices and a move away from first-generation technologies for large-scale production of biofuels, for example, but the need to produce more with less — and to do so more sustainably and in a manner that prioritizes the poor — will remain.
To assess the relative impact of two alternative development pathways in 2030 and 2050, IFPRI modeled the future world food system under two scenarios:
- The Conventional World scenario (as shown in Figure 3.3 above) reflects a continuation of recent trends in population and economic growth and other variables, including limited investment in agricultural research and thus in land, water, and energy efficiency. First-generation biofuel development continues following set mandates. Moreover, greenhouse gas emissions rapidly increase, water scarcity grows, and hunger and malnutrition remain serious problems in developing countries (Nelson et al. 2010; Rosegrant et al. 2008a).
- The Sustainable World scenario (as shown in Figure 5.1) focuses on increased agricultural research and development spending in developing countries, coupled with increased social investments and more judicious use of natural resources to sustainably improve rural livelihoods and incomes.
The Sustainable World scenario postulates an increased focus on the conservation of water, land, and energy resources through more investment in technologies and more efficient resource use. It focuses on those investments that reduce hunger and malnutrition, such as enhanced crop yields and livestock growth and increased investments in sanitation and female secondary education. Other factors are also crucial for better outcomes for the poor and the environment, including improved governance, reduced inequality and greater inclusion of marginalized social groups. Compared with the Conventional World, this scenario includes both higher economic growth and lower population growth (using the UN low-variant projection of population growth) (see also Nelson et al. 2010).
Moreover, the scenario projects rapid increases in water productivity and agricultural growth with increased efficiency in the use of research, among other things, as a result of spillover effects. As a result, by 2030, grain yields are 15 percent greater than in the Conventional World scenario, and by 2050, they are 35 percent larger. Livestock yields and herd size increase by 30 percent from 2015 to 2050 compared with the Conventional World Scenario. Moreover, there is a more aggressive move toward second-generation biofuel development. The Sustainable World scenario also meets a climate change target of no more than a 2˚C rise in temperature. Increased investments help ensure that all girls have access to secondary schooling by 2030 and all people have access to safe drinking water by 2050.
These two development pathways have significantly different results for land and water. Under the Conventional World scenario, total harvested crop area is expected to grow globally at 0.23 percent a year, or 169 million hectares in total, during the period 2005–2050. The contractions in crop area in some industrial and Asian countries are more than offset by increases in Sub-Saharan Africa and Latin America. Much of the area expansion, however, will come from marginal and forest areas. In the Sustainable World scenario, important forest areas can be preserved as crop area contracts by 116 million hectares by 2030, and by 201 million hectares by 2050. Furthermore, total water withdrawals are 544 cubic kilometres lower by 2030, and 1,369 cubic kilometres below Conventional World levels by 2050. This scenario thus releases large resources for important domestic and environmental water needs.
The two scenarios also have divergent results for food prices and nutrition. As a result of very high agricultural productivity growth in the Sustainable World scenario, average cereal prices are 21 percent lower by 2030 and 39 percent lower by 2050 compared with the Conventional World scenario. Significantly lower food prices under the Sustainable World scenario boost affordability and thus access to food, increasing daily calorie availability in the developing world by 496 kilocalories per capita by 2030, and by 1,336 kilocalories per capita by 2050. Thanks to large new agricultural and social investments in developing countries, as well as more efficient use and preservation of natural resources, the Sustainable World scenario results in 50 million malnourished children in 2050, compared with 115 million in the Conventional World scenario - a sharp decline of 57 percent. In India, for example, which is home to the largest number of malnourished children, the proportion of malnourished children would decline to 27 percent in the Sustainable World scenario by 2050, compared with 39 percent in the Conventional World scenario.
The calculations show that eradicating hunger in the near and medium term is a complex, multifaceted challenge. Significant achievements can be made through changes in investments and policies. Key factors that can make a difference for child malnutrition include accelerated growth in a diversity of crops, access to safe drinking water, and full female secondary school enrollment. Many of these changes both contribute to and will be driven by higher economic growth and slower population growth. The Sustainable World scenario assumes continued use of land and water resources for first-generation biofuel production following current mandates, but has a much larger focus on second-generation technologies. Removing current biofuel mandates would arguably have additional positive impacts for the eradication of child malnutrition, as well as water, land, and biodiversity conservation.
A sustainable vision for 2050 would mean that everyone in the world has access to, and is empowered to make use of, food, modern energy, and clean water while at the same time ecosystem degradation is halted or reversed. In the Sustainable World scenario, humankind makes large strides toward reducing hunger and improving water access but cannot entirely eliminate hunger and malnutrition by 2050. Achieving that goal would require additional targeted policies and institutional investments in key food crisis areas and other targeted, supporting measures (such as social support systems) for those suffering from chronic hunger (see also Runge et al. 2003).
Footnotes
- The UN also projects low- and high-variant scenarios of population growth.
- Determinants of fertility rate change are social, cultural, and economic variables, such as women’s education level, employment status, urban-rural residence, household poverty, the cost of raising children, the cost of contraception, women’s autonomy, and husband’s occupation (World Bank 2007).
- Cultivated systems are defined as areas where at least 30 percent of the landscape is in croplands, shifting cultivation, confined livestock production, or freshwater aquaculture.
- Net primary production is the rate of carbon dioxide fixation by vegetation minus losses through respiration. It is a widely used indicator of land degradation for global and regional studies because it can be captured by satellite, making it relatively inexpensive to measure. Another major advantage is that long-term time-series data are available, allowing for comparison of land degradation over time.
- These projections were calculated using IFPRI’s International Model for Policy Analysis of Agricultural Commodities and Trade, or IMPACT.
- A summary of these two scenarios is presented in Ozkaynak et al. (2012). The outcomes for these two scenarios were modeled using IFPRI's IMPACT model. IMPACT is designed to examine alternative futures for global food supply, demand, trade, prices, and food security. It covers 45 commodities, which account for virtually all of world food production and consumption. It is specified as a set of 115 country-level supply and demand equations where each country model is linked to the rest of the world through trade. To explore food security effects, IMPACT projects the percentage and number of malnourished preschool children (0 to 5 years old) in developing countries as a function of average per capita calorie availability, the share of females with secondary schooling, the ratio of female to male life expectancy at birth, and the percentage of the population with access to safe water. The model is integrated with a Water Simulation Module and a Global Hydrologic Model to assess the impacts of water supply and demand and climate change, respectively, on food outcomes. The model includes energy crops but not a full energy model.
- Many of these factors, however, can only be assessed qualitatively; they are outside the reach of quantitative simulation models.