Photo: Stefanie Glinski /Welthungerhilfe, Türkiye, 2023; Youth are an important but often overlooked cohort that suffers disproportionately from crises and food and nutrition insecurity. In the wake of the February 2023 earthquake in Türkiye, a woman prepares fresh meals for displaced people. Thousands of people live in temporary shelters with no possibility to cook for themselves and no access to education. Hide
Note: The results within this 2023 Global Hunger Index report supersede all previous GHI results. The 2000, 2008, and 2015 scores and indicator data contained within this report are currently the only data that can be used for valid comparisons of the GHI over time.
The Global Hunger Index (GHI) is a tool designed to comprehensively measure and track hunger at global, regional, and national levels, reflecting multiple dimensions of hunger over time. The GHI is intended to raise awareness and understanding of the struggle against hunger, provide a way to compare levels of hunger between countries and regions, and call attention to those areas of the world where hunger levels are highest and where the need for additional efforts to eliminate hunger is greatest.
How the GHI Is Calculated
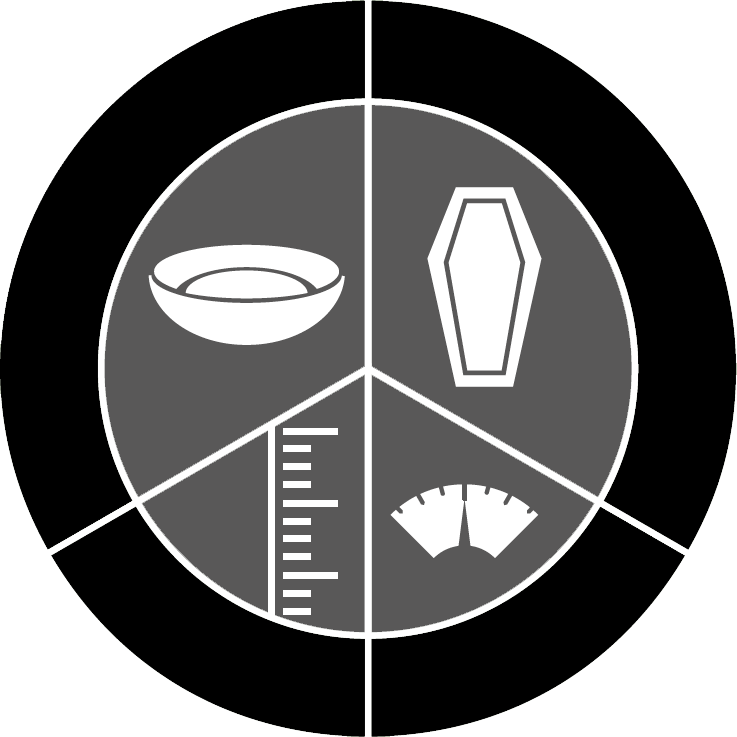
Each country’s GHI score is calculated based on a formula that combines four indicators that together capture the multidimensional nature of hunger:
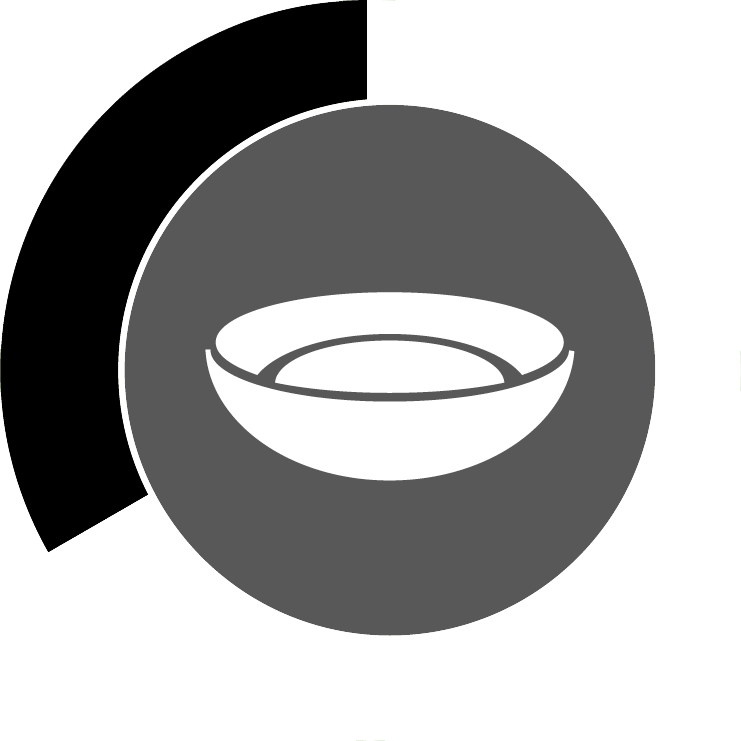
Undernourishment: the share of the population whose caloric intake is insufficient;
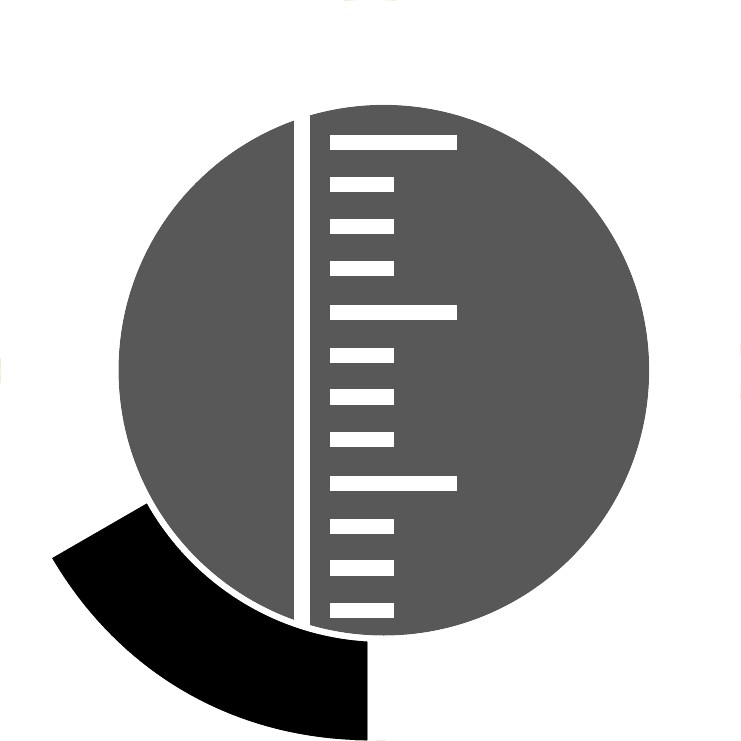
Child stunting: the share of children under the age of five who have low height for their age, reflecting chronic undernutrition;
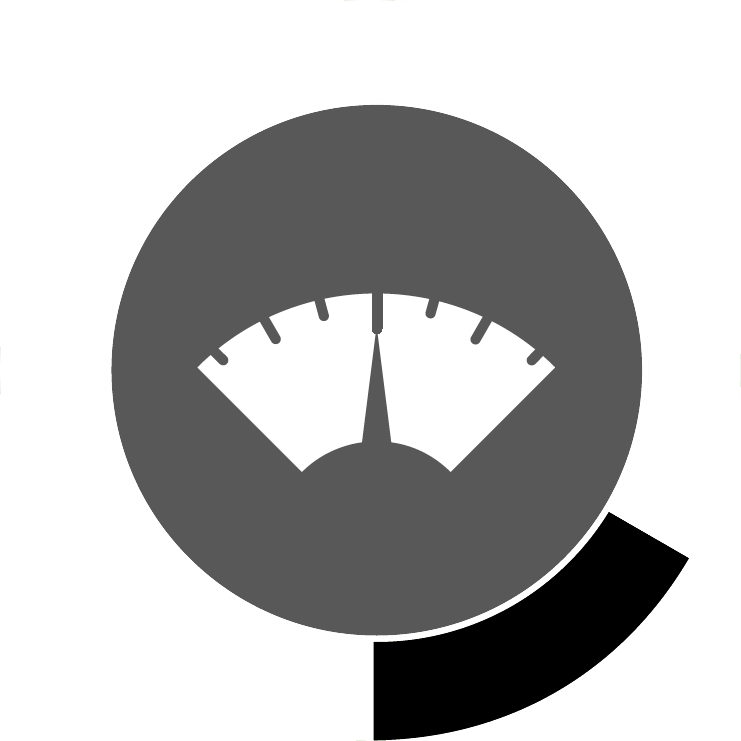
Child wasting: the share of children under the age of five who have low weight for their height, reflecting acute undernutrition; and
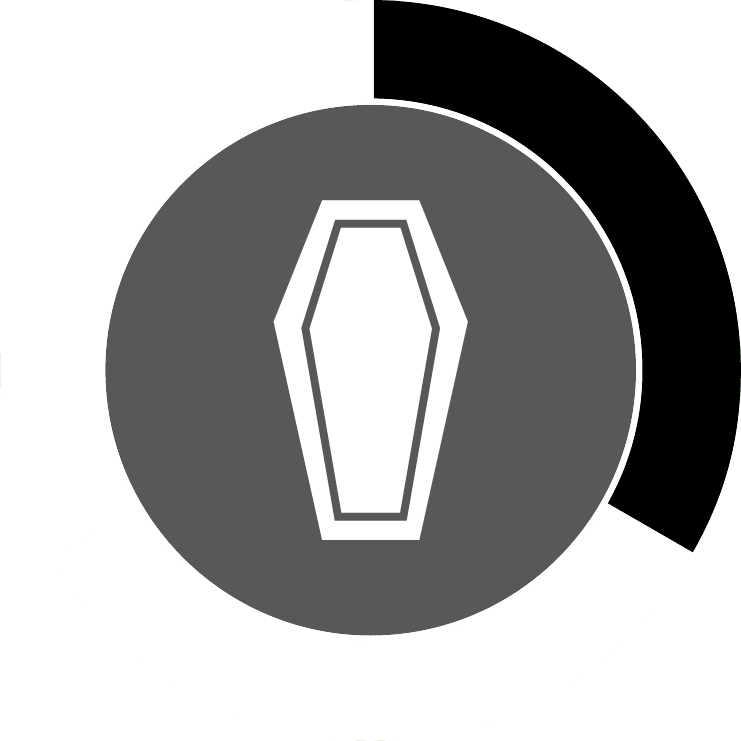
Child mortality: the share of children who die before their fifth birthday, reflecting in part the fatal mix of inadequate nutrition and unhealthy environments.
Using this combination of indicators to measure hunger offers several advantages (see Table A.1). The indicators included in the GHI formula reflect caloric deficiencies as well as poor nutrition. The undernourishment indicator captures the food access situation of the population as a whole, while the indicators specific to children reflect the nutrition status within a particularly vulnerable subset of the population for whom a lack of dietary energy, protein, and/or micronutrients (essential vitamins and minerals) leads to a high risk of illness, poor physical and cognitive development, and death.
The inclusion of both child wasting and child stunting allows the GHI to document both acute and chronic undernutrition. By combining multiple indicators, the index minimizes the effects of random measurement errors. These four indicators are all part of the indicator set used to measure progress toward the United Nations Sustainable Development Goals (SDGs).
BOX A.1
WHAT IS MEANT BY “HUNGER”?
The problem of hunger is complex, and different terms are used to describe its various forms.
Hunger is usually understood to refer to the distress associated with a lack of sufficient calories. The Food and Agriculture Organization of the United Nations (FAO)
defines food deprivation, or undernourishment, as the habitual consumption of too few calories to provide the minimum dietary energy an individual requires to live a healthy and productive life, given that person’s sex, age, stature, and physical activity level.
Undernutrition goes beyond calories and signifies deficiencies in any or all of the following: energy, protein, and/or essential vitamins and minerals. Undernutrition is the result of inadequate intake of food in terms of either quantity or quality, poor utilization of nutrients in the body due to infections or other illnesses, or a combination of these immediate causes. These, in turn, result from a range of underlying factors, including household food insecurity; inadequate maternal health or childcare practices; or inadequate access to health services, safe water, and sanitation.
Malnutrition refers more broadly to both undernutrition (problems caused by deficiencies) and overnutrition (problems caused by unbalanced diets that involve consuming
too many calories in relation to requirements, with or without low intake of micronutrient-rich foods). Overnutrition—resulting in overweight, obesity, and noncommunicable diseases—is increasingly common throughout the world, with implications for human health, government expenditures, and food systems development. While overnutrition is an important concern, the GHI focuses specifically on
issues relating to undernutrition.
In this report, “hunger” refers to the index based on the four component indicators (undernourishment, child stunting, child wasting, and child mortality). Taken together, the component indicators reflect deficiencies in calories as well as in micronutrients.
Table A.1
HOW THE FOUR INDICATORS UNDERLYING THE GHI CAPTURE THE MULTIDIMENSIONAL NATURE OF HUNGER
Undernourishment
Child stunting
Child wasting
Child mortality
Measures inadequate food access, an important indicator of hunger
Refers to the entire population, both children and adults
Is used as a lead indicator for international hunger reduction targets, including Sustainable Development Goal 2 (Zero Hunger)
Go beyond calorie availability, consider aspects of diet quality and utilization
Reflect children’s particular vulnerability to nutritional deficiencies
Are sensitive to uneven distribution of food within the household
Are used as nutrition indicators for SDG 2 (Zero Hunger)
Reflects that death is the most serious consequence of hunger, and children are the most vulnerable
Improves the GHI’s ability to reflect deficiencies of essential vitamins and minerals
Complements stunting and wasting, which only partially capture the mortality risk of undernutrition
GHI scores are calculated using a three-step process:
Values are determined for the four component indicators for each country, drawing on the latest published data available from internationally recognized sources.
Each of the four component indicators is given a standardized score based on thresholds set slightly above the highest country-level values observed worldwide for that indicator since 1988. For example, the highest value for undernourishment estimated in this period is 76.5 percent, so the threshold for standardization is set slightly higher, at 80 percent. In a given year, if a country has an undernourishment prevalence of 40 percent, its standardized undernourishment score for that year is 50. In other words, that country is approximately halfway between having no undernourishment and reaching the maximum observed level. Here are the formulas used to standardize each indicator:
Prevalence of undernourishment80
x100 =
standardized undernourishment value
Child stunting rate70
x100 =
standardized child stunting value
Child wasting rate30
x100 =
standardized child wasting value
Child mortality rate35
x100 =
standardized child mortality value
The standardized scores are aggregated to calculate the GHI score for each country. Undernourishment and child mortality each contribute one-third of the GHI score, while child stunting and child wasting each contribute one-sixth of the score, as shown in the formula (Figure A.1).
This calculation results in GHI scores on a 100-point scale, where 0 is the best score (no hunger) and 100 is the worst. In practice, neither of these extremes is reached. A value of 100 would signify that a country’s undernourishment, child wasting, child stunting, and child mortality levels each exactly meets the thresholds set slightly above the highest levels observed worldwide in recent decades. A value of 0 would mean that a country had no undernourished people in the population, no children younger than five who were wasted or stunted, and no children who died before their fifth birthday.
FIGURE A.1
COMPOSITION OF GHI SCORES AND SEVERITY DESIGNATIONS
Note: All indicator values are standardized.
1/3
Undernourishment
+
1/6
Child stunting
+
1/6
Child wasting
+
1/3
Child mortality
=
GHI Score
GHI Severity of Hunger Scale
≤ 9.9
Low
10.0–19.9
Moderate
20.0–34.9
Serious
35.0–49.9
Alarming
≥ 50.0
Extremely alarming
100-point scale
Where the Indicator Data Come From
Data used in the calculation of GHI scores come from various UN and other multilateral agencies, as shown in Table A.2. The GHI scores reflect the latest revised data available for the four indicators. Where original source data were unavailable, estimates for the GHI component indicators were made based on the most recent available data.
How Hunger Severity Is Determined for Countries with Incomplete Data
In this year’s GHI report, 136 countries met the criteria for inclusion in the GHI, but 11 had insufficient data to allow for calculation of a 2023 GHI score. To address this gap and give a preliminary picture of hunger in the countries with missing data, provisional designations of the severity of hunger were determined based on several known factors (see Table A.3):
those GHI indicator values that are available,
the country’s last known GHI severity designation,
the prevalence of undernourishment for the subregion in which the country is located, and/or
assessment of the relevant findings of the 2021, 2022, and 2023 editions of the Global Report on Food Crises(FSIN and GNAFC 2021, 2022, 2023).
For some countries, data are missing because of violent conflict or political unrest (FAO et al. 2017; Martin-Shields and Stojetz 2019), which are strong predictors of hunger and undernutrition. The countries with missing data may often be those facing the greatest hunger burdens. Of the three countries provisionally designated as alarming—Burundi, Somalia, and South Sudan—it is possible that with complete data, one or more of them would fall into the extremely alarming category. However, without sufficient information to confirm that this is the case, we have conservatively categorized each of these countries as alarming.
In some cases even a provisional severity designation could not be determined, such as if the country had never previously had a prevalence of undernourishment value, GHI score, or GHI designation since the first GHI report was published in 2006. In the cases of Somalia and South Sudan, data were unavailable for two out of four GHI indicators. However, a review of the relevant information in the 2021, 2022, and 2023 editions of the Global Report on Food Crises as well as consultations with experts on food and nutrition insecurity in these two countries made clear that designations of alarming were justified.
Table A.2
DATA SOURCES AND REFERENCE YEARS FOR THE GLOBAL HUNGER INDEX COMPONENT INDICATORS, 2000, 2008, 2015, AND 2023
Indicator
Data sources
Reference years for indicator data
2000 GHI scores (122 countries)
2008 GHI scores (125 countries)
2015 GHI scores (125 countries)
2023 GHI scores (125 countries)
Prevalence of undernourishment
FAO 2023
2000–2002a
2007–2009a
2014–2016a
2020–2022a
Child stunting and wasting
WHO 2023; UNICEF et al. 2023a; UNICEF 2023a, 2013, and 2009; MEASURE DHS 2023
1998–2002b
2006–2010c
2013–2017d
2018–2022e
Child mortality
UN IGME 2023a
2000
2008
2015
2021
Note: The number of countries for which sufficient data were available to calculate GHI scores for each year or time span is shown in parentheses.
a Three-year average.
b Data collected from the years closest to 2000; where data from 1998 and 2002 or 1999 and 2001 were available, an average was used.
c Data collected from the years closest to 2008; where data from 2006 and 2010 or 2007 and 2009 were available, an average was used.
d Data collected from the years closest to 2015; where data from 2013 and 2017 or 2014 and 2016 were available, an average was used.
e The latest data gathered in this period.
Understanding and Using the Global Hunger Index: FAQs
Photo: Ed Ram/Concern Worldwide, 2022; Nuurto stands resilient at her shop on the outskirts of Baidoa, Somalia, navigating the challenges of Drought, a Food Crisis, and the relentless grip of the Climate Crisis. Hide
Which countries are included in the GHI?
Inclusion in the GHI is determined based on prevalence of undernourishment and child mortality data dating back to 2000. Countries with values above the “very low” threshold for one or both of these indicators since 2000 are included in the GHI. Specifically, countries are included if the prevalence of undernourishment was at or above 5.0 percent and/or if the child mortality rate was at or above 1.0 percent for any year since 2000. Data on child stunting and child wasting, the other indicators used in the calculation of GHI scores, are not included in the inclusion criteria because their availability varies widely from country to country, with data especially limited for higher-income countries. Non-independent territories are not included in the GHI, nor are countries with very small populations (under 500,000 inhabitants), owing to limited data availability.
Because data for all four indicators in the GHI formula are not available for every country, GHI scores could not be calculated for some. However, where possible, countries with incomplete data are provisionally categorized according to the GHI Severity of Hunger Scale based on existing data and complementary reports (see Table A.3). Several of these countries are experiencing unrest or violent conflict, which affects the availability of data as well as the food security and nutrition situation in the country. It is possible that one or more of these countries would have a higher GHI score than the Central African Republic—the country with the highest 2023 GHI score—if sufficient data were available.
Why is a certain country’s GHI score so high (or so low)?
The key to understanding a country’s GHI score lies in that country’s indicator values, especially when compared with the indicator values for other countries in the report (see Appendix B for these values).
For some countries, high scores are driven by high rates of undernourishment, reflecting a lack of calories for large swathes of the population. For others, high scores result from high levels of child wasting, reflecting acute undernutrition; child stunting, reflecting chronic undernutrition; and/or child mortality, reflecting children’s hunger and nutrition levels, in addition to other extreme challenges facing the population. Broadly speaking, then, a high GHI score can be evidence of a lack of food, a poor-quality diet, inadequate child care-giving practices, an unhealthy environment, or a combination of these factors.
While it is beyond the scope of this report to provide a detailed explanation of the circumstances facing each country with a GHI score, Trends describes the situation in select countries. Furthermore, this report offers other avenues for examining a country’s hunger and nutrition situation: country rankings based on 2023 GHI scores appear in Ranking, GHI scores for selected years for each country appear in Appendix C, and regional comparisons appear in Appendix D. Case studies of the hunger situation in specific countries are also available.
Does the 2023 GHI reflect the situation in 2023?
The GHI uses the most up-to-date data available for each of the GHI indicators, meaning the scores are only as current as the data. For the calculation of the 2023 GHI scores, undernourishment data are from 2020–2022; child stunting and child wasting data are from 2018–2022, with the most current data from that range used for each country; and child mortality data are from 2021. Any changes that occur in 2023 are not yet reflected in the data and scores in this year’s report.
How can I compare GHI results over time?
Each report includes GHI scores and indicator data for three reference years in addition to the focus year. In this report, the 2023 GHI scores can be directly compared with the GHI scores given for three reference years—2000, 2008, and 2015 (Appendix C). The reference years are selected to provide an assessment of progress over time while also ensuring there is no overlap in the range of years from which the data are drawn.
Can I compare the GHI scores and indicator values in this report with results from previous reports?
No—GHI scores are comparable within each year’s report, but not between different years’ reports. The current and historical data on which the GHI scores are based are continually being revised and improved by the United Nations agencies that compile them, and each year’s GHI report reflects these changes. Comparing scores between reports may create the impression that hunger has changed positively or negatively in a specific country from year to year, whereas in some cases the change may partly or fully reflect a data revision.
Moreover, the methodology for calculating GHI scores has been revised in the past and may be revised again in the future. In 2015, for example, the GHI methodology was changed to include data on child stunting and wasting and to standardize the values (see Wiesmann et al. 2015). This change caused a major shift in the GHI scores, and the GHI Severity of Hunger Scale was modified to reflect this shift. In the GHI reports published since 2015, almost all countries have had much higher GHI scores compared with their scores in reports published in 2014 and earlier. This does not necessarily mean their hunger levels rose in 2015—the higher scores merely reflect the revision of the methodology. The 2000, 2008, 2015, and 2023 GHI scores shown in this year’s report are all comparable because they all reflect the revised methodology and the latest revisions of data.
Can I compare the GHI rankings in this report to those in previous reports to understand how the situation in a country has changed over time relative to other countries?
No—like the GHI scores and indicator values, GHI rankings cannot be compared between GHI reports, for two main reasons. First, the data and methodology used to calculate GHI scores have been revised over time, as described above. Second, the ranking in each year’s report often includes different countries because the set of countries for which sufficient data are available to calculate GHI scores varies from year to year. Thus, if a country’s ranking changes from one report to the next, this may be in part because it is being compared with a different group of countries.
Footnotes
For further background on the GHI concept, see Wiesmann, von Braun, and Feldbrügge (2000), Wiesmann (2006), and Wiesmann et al. (2015).
According to Black et al. (2013), undernutrition is responsible for 45 percent of deaths among children under the age of five.
The average minimum dietary energy requirement varies by country—from about 1,660 to 2,040 kilocalories (commonly, albeit incorrectly, referred to as calories) per person per day for all countries with available data for 2022 (FAO 2023).
The thresholds for standardization are set slightly above the highest observed values to allow
for the possibility that these values could be exceeded in the future.
The threshold for undernourishment is 80, based on the observed maximum of 76.5 percent; the threshold for child wasting is 30, based on the observed maximum of 26.0 percent; the threshold for child stunting is 70, based on the observed maximum of 68.2 percent; and the threshold for child mortality is 35, based on the observed maximum of 32.6 percent. While the thresholds were originally established based on the maximum values observed between 1988 and 2013, covering 25 years’ worth of available data prior to the methodological review process, these values have not been exceeded since then.
For previous GHI calculations, see von Grebmer et al. (2022, 2021, 2020, 2019, 2018, 2017, 2016, 2015, 2014, 2013, 2012, 2011, 2010, 2009, 2008); IFPRI, WHH, and Concern
Worldwide (2007); and Wiesmann, Weingärtner, and Schöninger (2006).
Previously published undernourishment values, GHI scores, and GHI severity classifications are not considered valid once superseding reports have been issued, but are used as benchmarks to consider the plausibility of a country falling into a broad range of undernourishment values and GHI scores.
The Global Reports on Food Crises report on acute food insecurity, which is different from chronic hunger as measured by the prevalence of undernourishment. However, the 2021, 2022, and 2023 GRFCs were used to confirm whether a country experienced extreme hunger crises such as famine, threat of famine, and/or repeated hunger crises in 2020, 2021, and 2022.
Even though food insecurity is a serious concern for segments of the population in certain high-income countries, nationally representative data for child stunting and child wasting are not regularly collected in most high-income countries. In addition, although data on child mortality are usually available for these countries, child mortality does not reflect undernutrition in high-income countries to the same extent it does in low- and middle-income countries.